One of the primary sources of unreliability of 2MASS detections is confusion with artifacts produced by bright stars. These artifacts include familiar optical effects such as diffraction spikes, ghost images, and filter and dichroic glints, as well as features unique to the NICMOS3 detectors used by 2MASS such as latent images and "stripes" (see below).
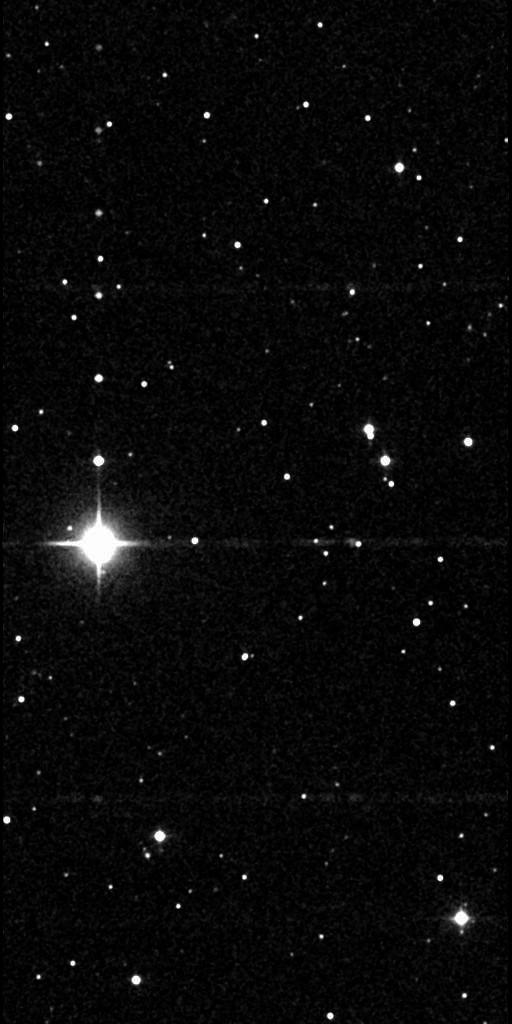
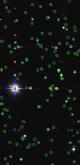
The following J-Band Atlas Image from the northern night of 1997 Nov 16 UT (Figure 1), contains the bright star 2MASSI J0245091+285123 (= HD17054; J=5.8, H~5.1, Ks=4.9 mag). Figure 2 shows the same image with source detections in a "blinking" (or "animated") overlay. "Sources" associated with artifacts from this star and others marked with squares. Note that these artifacts are not included in the Point Source Catalog. The color coding of the squares is as follows:
|
|
| Figure 1 | Figure 2 | |
During pipeline processing for each 2MASS Tile, artifacts are identified in the extracted source lists by searching for detections that have the correct positional and brightness relationship to bright stars. All sources, true and artifact, are output to the Working Source Databases, but artifacts are flagged therein. Detections that are highly probable artifacts are not included in the final release Catalogs for 2MASS. Sources which are believed to be real objects on the sky, but may have positional or brightness measurements affected by nearby artifacts are flagged in the appropriate bands with the "cc_flg" (confusion and contamination flag) in the Second Incremental Release PSC. Users are urged to pay attention to the values in this flag.
Diffraction Spikes
Diffraction spikes are linear features that extended in the north-south and east-west directions from bright stars. They have approximately constant widths, and lengths dependent on the parent source's magnitude, although at large distances from very bright stars the east-west diffraction spikes fan slightly. All sources found within the predicted boundaries of a spike are at least contaminated by the spike. Those fainter than a fixed magnitude threshold based on the parent star brightness are considered spurious detections and are culled from the Catalog during the Catalog Generation process. Sources brighter than the threshold are included in the release Catalogs, but are marked as contaminated by the spike. Such contaminated point source have a value of "D" in the appropriate band in the "cc_flg" in the PSC record.
Persistence Artifacts
When a very bright source illuminates pixels on a NICMOS3 array, a latent signal that decays with time will persist in subsequent reads of those pixels. Because of the regular stepping in declination of 2MASS scanning, bright stars will leave a "trail" of false stars of diminishing brightness, spaced at regular intervals in the direction opposite to the scanning. The brightness and duration of the persistence "trail" is a repeatable function of the parent source brightness. Note the prominent persistence trail extending north of HD17054 in the image above, as well as the fainter persistence artifacts just north of even much fainter stars. Because these artifacts appear stellar, they are particularly insidious especially when inspecting 2MASS images. The location of known persistence image artifacts are shown as overlays on the 2MASS Atlas Images that are retrieved using the IRSA/2MASS Survey Visualizer.
Because the scanning step size is known very accurately, and because
the decay in brightness of the latent images is well understood,
spurious detections of persistence artifacts can be identified in the
source lists during pipeline processing for each scan using simple
geometric and brightness relationships. For each detection that is
in the proximity of an expected persistence artifact, the probability
that it is an artifact is evaluated based on a positional and brightness
 2 function.
The probability is normalized such that
values >0.5 are likely persistence artifacts, and are culled
from the final Catalog source lists. Objects with persistence
probabilities between 0.1-0.5 are included in the Catalog lists,
but are flagged as having measurements that are likely influenced
by nearby persistence artifacts. The "cc_flg" value corresponding to
persistence source contamination is "P."
2 function.
The probability is normalized such that
values >0.5 are likely persistence artifacts, and are culled
from the final Catalog source lists. Objects with persistence
probabilities between 0.1-0.5 are included in the Catalog lists,
but are flagged as having measurements that are likely influenced
by nearby persistence artifacts. The "cc_flg" value corresponding to
persistence source contamination is "P."
Filter and Dichroic Glints
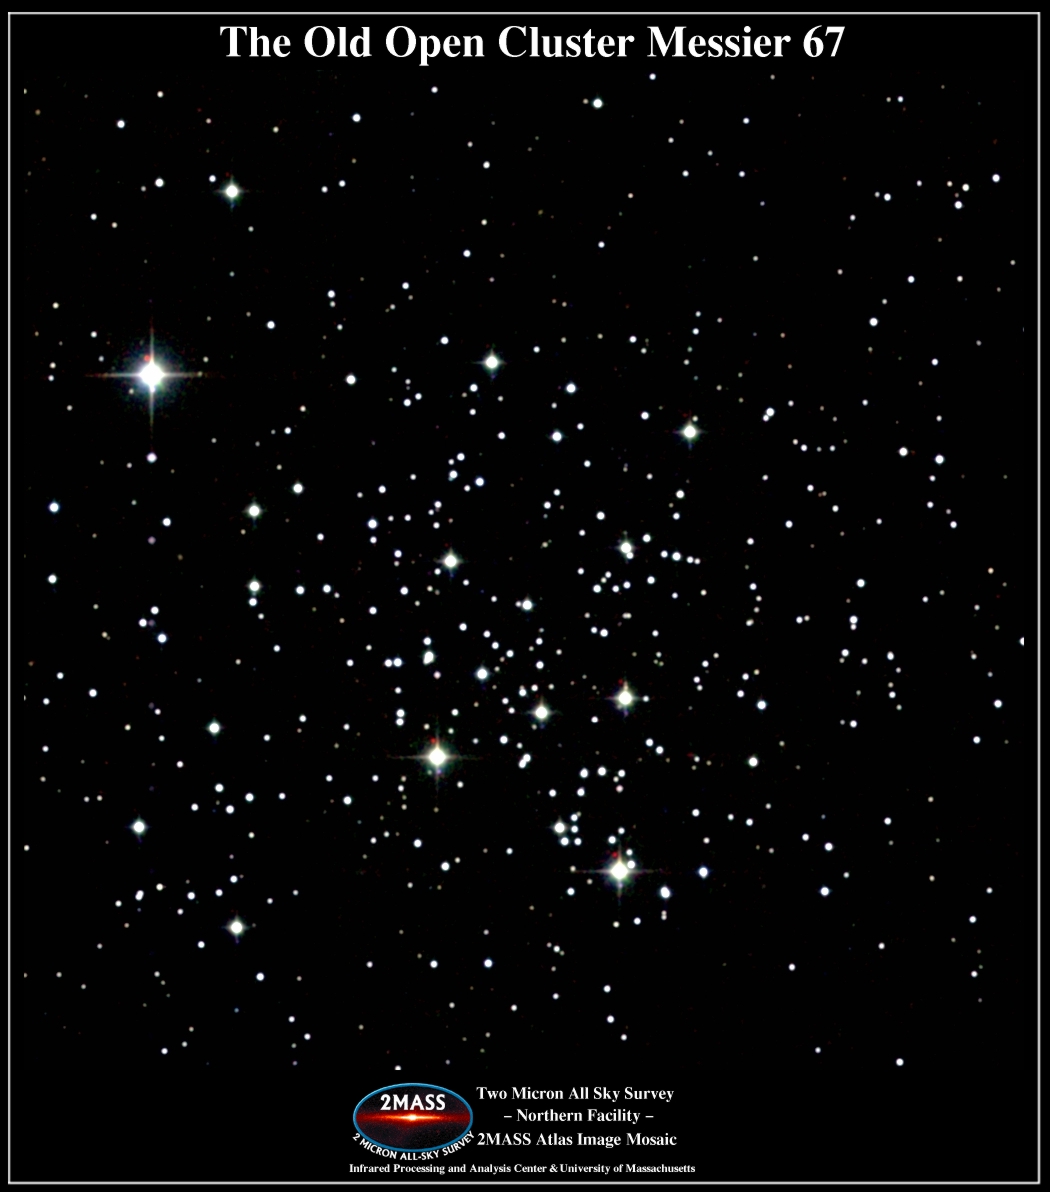
Glints are point-like images that result from internal reflections of bright stars within the filter and dichroics of the 2MASS cameras. They are found at well-defined positional offsets relative to the bright source, and have magnitudes that are approximately constant offsets from the bright source's magnitude. For both the northern and southern 2MASS cameras, the glints lie within 34´´ of the parent object. Like persistence artifacts, the glints are stellar in appearance, so they can be easily confused with real objects on the sky in the images. The filter and dichroic glints have the added feature that they do not appear in all bands, so they can have extreme apparent colors. For example, because the Ks light passes through two dichroics, there is a Ks-only dichroic that produces red "companions" to all bright stars in 3-color composite images produced from the 2MASS Atlas Images. An example of these can be seen just to the northeast of the brighter stars in the 2MASS Image Gallery image of M67.
Glint artifacts are found in the detection lists during scan pipeline processing by searching for objects near the predicted position offset from a bright star that also have magnitudes within the uncertainty bounds of the expected magnitude. Such objects are culled from the detection lists and not included in the released 2MASS Catalogs during the Catalog generation process.
As with persistence artifacts, the position of filter and dichroic glints are indicated on overlays to the Atlas Images retrieved using the IRSA/2MASS Survey Visualizer.
Stripes
Horizontal "stripe" artifacts extend in the east-west direction at the declination of very bright stars, as well as at 256´´ north and south of the stars position. They extend the width of a scan, and they are probably some form of electronic residual of the bright star. These stripes are much fainter than diffraction spikes.
Any detections that fall within the area covered by a stripe may have photometry affected by the artifact. Such objects are flagged with an "S" in the "cc_flg".
Bright Star Confusion
Sources that are saturated in the "Read 2-Read 1" (R2-R1) exposures usually
cause a flood
of false R2-R1 detections in and around their cores. The radius in which
these false detections are found is termed the "confusion" radius, and is
dependent on the brightness of the parent object. for very bright
objects, such as  Pegasi
(Ks~-1.9) in the Second Incremental
Data Release, the confusion radius can be many arcminutes.
R2-R1 sources found within the confusion radius around a very bright star
are identified as a spurious detections and not selected for inclusion
in the release Catalogs. "Read 1" (R1) detections
found within the confusion radius of a bright star, which are
not the primary detection of the star, can be passed to the release
catalogs but are flagged as confused ("cc_flg" = "C") in the Point Source
record since their photometry is contaminated by the nearby star.
Pegasi
(Ks~-1.9) in the Second Incremental
Data Release, the confusion radius can be many arcminutes.
R2-R1 sources found within the confusion radius around a very bright star
are identified as a spurious detections and not selected for inclusion
in the release Catalogs. "Read 1" (R1) detections
found within the confusion radius of a bright star, which are
not the primary detection of the star, can be passed to the release
catalogs but are flagged as confused ("cc_flg" = "C") in the Point Source
record since their photometry is contaminated by the nearby star.
Artifacts from Very Bright Stars
Artifact identification within the scan processing pipeline requires a
good estimate of the parent source brightness, and is limited to knowledge of
stars that fall within the Tile being processed.
Very bright stars can have confusion radii, diffraction spikes and
ghost reflections that span more than one 2MASS Tile. An extreme
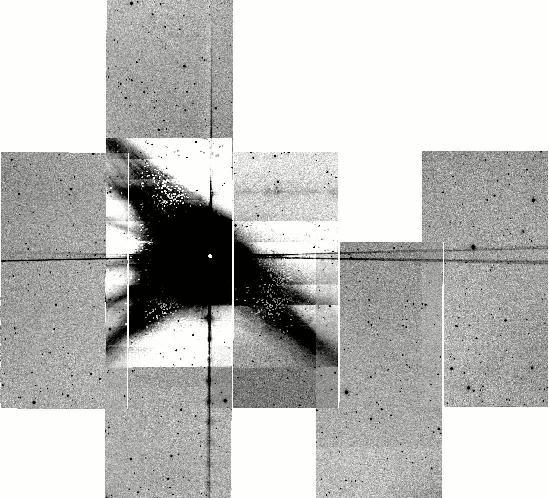
example of this is shown in Figure 3,
which is a montage of several J-band images centered on
Peg, which is covered in the
Second Incremental Release area.
The montage covers a region five tiles in width, and clearly shows
the large confusion "halo" and extensive diffractions spikes of the
Ks~-1.9 mag star.
|
| Figure 3 |
Artifacts from such bright stars are identified during the Catalog Generation procedure using a combined Working Database of sources extracted from all Tiles in the Release. Position and relative brightness relationships are again used to find the artifacts, but the relationships are more conservative than those used in the scan processing. This places an intentional emphasis on reliability in the Point Source Catalog at the expense of some completeness in the vicinity of bright stars. Because the behavior of the diffraction spikes at large distances from the star are difficult to characterize, extra-wide diffraction spike masks were used in identifying artifacts from the very bright stars. The length of the spikes is a function of source brightness, but the widths are constant. Additionally, a larger confusion radius is used for these objects because of large uncertainties in their brightnesses.
Stars which are heavily saturated in even the 51-ms R1 exposure often do not have good position or brightness estimates, and therefore cannot be used as "parents" in the search for artifacts. To account for such objects, a list of sources brighter than magnitude=5 in J, H or Ks was compiled from published lists of infrared photometry, including the TMSS and the Catalog of Infrared Observations (Gezari, Schmitz & Meade 1987, NASA Publication 1196). For bright stars without existing published near infrared photometry, near infrared magnitudes were estimated by 1) using visual photometry and colors from the Bright Star Catalog, and a model of visual-near infrared colors vs. optical color; or 2) extrapolating from mid-infrared brightnesses taken from IRAS or the Midcourse Space Experiment (MSX) catalogs, for stars which did not have visual colors available. Positions for these objects are typically drawn from the PPM.
Figure 4 is a source density plot from the PSC near the Galactic plane for Ks < 14.5 mags. The sources removed because of conservative artifact blanking from the very bright stars produce an obvious "mask".
|
| Figure 4 |
The brightness estimates for these stars are highly uncertain because many of them are variable AGB stars, and because the interpolations from visual or IRAS flux densities are uncertain. Placeholders have been added to the PSC for these bright stars. All magnitudes for these placeholders are set to -99.999, and the rd_flg values are listed as "888."
[Last updated: 2000 February 18, by R. Cutri and T. Evans]