 |
 |
3.Results2.1. CORRECTION OF THE POSITION OF SCANS
2.2 FLUX CALIBRATION
2.3. CORRECTION FOR POLARIZATION CROSS-TALK
2.4. BACKGROUND SUBTRACTION
2.5. COMPUTATION OF A DIRTY MAP AND CLEANING
Abstract. We present two-dimensional solar maps at 2.7, 3.2, 4, and 8.2 cm computed from one-dimensional observations with the RATAN-600, using Earth rotation aperture synthesis techniques. Before the calculation of maps, the position of each scan was corrected with respect to the center of the solar disk and the scans were calibrated. The circular polarization scans were corrected for polarization cross-talk between the I and V channels. Subsequently, the quiet-Sun background emission was subtracted. After all corrections, a dirty map was computed by combining the scans at different position angles. The last step of the processing was an attempt to free the dirty map of the sidelobes, using the standard CLEAN procedure. The resolution of the clean maps at 2.7 cm was 0.5' by 5'. Both active regions which were present on the solar disk were mapped. We studied the flux spectra of different types of sources: one was associated with a sunspot, the second was located over the neutral line of an active region, and the other was associated with the plage. The emission mechanism of the former was attributed to the gyroresonance process, while the short wavelength emission of the others was attributed to the free-free process. For the sunspot-associated source we estimated the magnetic field strengths at the base of the transition region and in the low corona.
The study of the microwave emission of solar active regions needs high spatial resolution observations together with a wide frequency coverage. Observations at different wavelengths sample different heights and physical conditions in the solar atmosphere, with longer wavelengths referring to higher levels. The generating mechanism of radio waves from active regions is wavelength dependent. Thus high resolution multi-frequency VLA observations at 2, 6, and 20 cm help to distinguish between the emission mechanisms near the footpoints and near the apex of loop structures (Shevgaonkar and Kundu, 1984). More recent, high dynamic range VLA multi-frequency observations were used to probe the core-halo structure of active regions (White, Kundu, and Gopalswamy, 1'3')2). Multi-frequency microwave observations provide a unique tool for the determination of the three-dimensional structure of the magnetic field in the transition region (TR) and the low corona (Alissaadrakis et al., 1993; Lee, Hurford, and Gary, 1993), because the magnetic field in the corona cannot be measured with confidence from Zeeman splitting of coronal lines.
Multi-frequency observations obtained from the RATAN-600 (Akhmedov et al., 1982; Kruger et al., 1986; Gelfreikh, Peterova, and Ryabov, 1987) allowed the spectral study of several types of sources associated with sunspot's, neutral lines of the longitudinal component of the photospheric magnetic field, plage as well as the halo component which is associated with the active region as a whole and is dominant in the range of 10 20 cm (Akhmedov et al., 1986). The instrument has been used so far only for one-dimensional observations of the Sun. The comparison of one-dimensional RATAN observations with simultaneous high-spatial-resolution observations obtained either from the VLA (Akhmedov et al., 1986; Bogod et al., 1992) or the WSRT (Alissandrakis et al., 1993) helped to derive a more precise picture of the active regions under study because the lack of two-dimensional RATAN observations was compensated in part by the VLA or the WSRT observations.
In this work we shall describe the use of the RATAN-600 as a two-dimensional instrument. The computation of two-dimensional maps from RATAN-600 observations was possible in July August, 1985 because observations at different position angles were available.
The RATAN-600 has the possibility of providing observations at different position angles (azimuths) before and after the Sun's transit through the local meridian. This observing mode gives an angular coverage with nearly 14' width. The RATAN-600 operated in this mode in July August 1985; thus the computation of two-dimensional maps was possible for that period.
The observations were obtained from July 31 to August 3, 1985. They consisted of one-dimensional fan beam scans of the Sun in total intensity (I) ahd circular polarization (V), which were recorded simultaneously at seven to eleven different position angles at ten wavelengths: 0.8, 2, 2.3, 2.7, 3.2, 4, 8.2, 11.7, 20.7, and 31.6 cm. The observations started 1 hour and 20 minutes before the Sun's transit through the local meridian and ended 1 hour and 20 minutes after the transit. The resolution of the RATAN-600 (in the east west and north south directions) is given in Table I.
Two active regions ivere resolved in scans recorded at wavelengths shorter than 8.~ cnl, hosvever at wavelengths from 0.8 to 2.3 cm th active region etllission was nearly at the same level as the quiet Sun. Consequently, scans at four wavelenghs (2.7 8.2 cm) were suitable for further analysis.
TABLE I
Resolution of RATAN scans
| Wavelength | E W resolution | N-S resolution | |
| (arc sec) | (arc min) | ||
|
2.0 2.3 2.7 3.2 4.0 8.2 11.7 20.7 31.6 |
17 19 23 27 34 72 96 180 264 |
13 15 18 21 26 53 76 134 205 |
|
2.1. CORRECTION OF THE POSITION OF SCANS
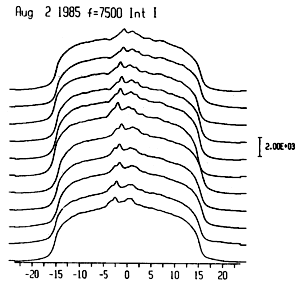
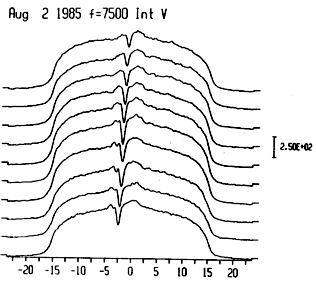
The RATAN data are in the form of one-dimensional scans recorded at different position,angles. The original scans are in the form of records of antenna temperature versus time. In Figure 1 we show the I and V RATAN scans for August 2 at 4 cm, plotted as a function of position. They were recorded at eleven position angles (10 for the V scans). Each full scan consists of 527 data points at this wavelength.
An inspection of the I scans shows that the middle of the scans was not exactly at the center of the solar disk, which is marked as 0 on the axis of Figure 1. Thus the first step of the data processing was to correct the position of each I scan with respect to the center of the solar disk. Our first approach was to compute the derivative of the scans and to place the center of the solar disk at the middle of the derivative peaks. However, this method did not always work, especially when high intensity local sources were 'present near the limb. Thus we developed an algorithm which performs 'scan folding' by computing the sums of the differences between data points near the east and west limbs. Then the scans were shifted by the appropriate value. The computed shift was in the range of 0.4 to 22 data points. The shift was greater at position angles far from the meridian. The V scans were shifted as much as the I scans of the same azimuth.
An inspection of the eastern and the western edge of the original scans
(Figure 1) shows that the sky level was not determined accurately. Thus
the first step in the calibration of the scans was the determination of
the sky level. We tried to reproduce
|
|
Fig. 1. The original one-dimensional RATAN scans in I and V for August 2, 1985 recorded at eleven position angles for I and 10 for V at 4 cm. In the abscissa is the position (arc min) in the east west direction. The intensity is in terms of antenna temperature.
the observed intensity at distances greater than 25' from the disk
center in scans recorded at long wavelengths (because no cut-off due to
the N S beam effect took place in these scans; see below), We formed
a circular disk with a radius equal to the radius of the Sun, we integrated
it along the north south direction and then we convolved the resulting
scan with the 20.7 cm beam pattern. However, we did not manage to reproduce
the scan intensity at distances far from the limb because the extent of
the theoretical beam pattern was limited (29'). Therefore we determined
the sky level by computing the average value of the intensities of the
first and the last 100 points of each scan at a given wavelength.
The relative calibration of the I scans was done by setting the flux of each scan to the flux of the scan recorded at zero azimuth. The adjustment to absolute flux units was done by setting the flux of the Sun in each scan to the values published in Solar Geophysical Data (interpolated and adjusted to the real Sun Earth distance}.
At short wavelengths the north south RATAN-600 beam is narrower than the diameter ot the Sun, so the beam cuts off a portion of the total tlux of the Sun. The computation of the beam cut-off was done as follows. We formed a circular disk with a radius equal to 18'. Subsequently, the disk was multiplied with the RATAN-600 N S beam and then was integrated along the E W and N S directions. We found that the beam cuts off 49%, 35%, and 26% of the total flux of the disk at 2.7, 3.2, and 4.0 cm, respectively. The comparison of our results, taking into account the beam effect, with the results derived from the calibration which was performed at the RATAN, showed that the RATAN fluxes had to be increased by about 20% (with the exception of 8.2 cm scans) in order to be consistent with our calibration.
2.3. CORRECTION FOR POLARIZATION CROSS-TALK
An inspection of the original scans (Figure 1) shows that they suffered from crosstalk from the I channel. This is shown better in the V channel which showed polarized emission far from the local sources in regions where the quiet-Sun component dominated.
The following method was useful for the correction ot the V scans. We computed the right circular polairizaition (R)and left circular polairization (L) scans from the initial I and V scans and we plotted R L diagrams of the quiet-Sun data points.
The plots indicated that in addition to the cross-talk there was some shift between R and L scans. We computed the shift using a method similar to the one described at the first step of the data reduction. The computed shift was in the range of 0.2 to 3 data points. We corrected for the shift and we went back to I and V.
Subsequently the V scans were corrected for the cross-talk effect. The observed (Iob, Vob) and the true (I, V) total intensity and circular polarization were related as follows:
Iob = Io +I+aV, (1)
Vob = Vo+aI+V, (2)
where a is a correction factor, and Io and Vo are the total intensity and circular polarization zero levels. Combining the above formulae for V = 0 we get
Thus the relation between Iob and Vob is, for V = 0,
Vob = c+dIob, (5)
where
c= Vo aIo (6)
d = a (7)
The parameters c and d were obtained through a least-square fit of the data. In order to correct V let us now rewrite Equations (1) and (2):
Iob Io = I+ aV, (8)
Vob Vo = aI + V . (9)
Combining (8) and (9) we get
Vob Vo = V + a(Iob Io) a2 V .(10)
Thus, we have
| Vob Vo - a(Iob Io) | |
| V = | -------------------- (11) |
| 1 a 2 |
and, using (6) and (7), the corrected value of 1' is
| Vob dIob - c | |
| V = | --------------- (12) |
| 1 d 2 |
The correction for I is negligible. By assuming the factor a to be a linear function of Iob better results were obtained for the quiet-Sun regions.
The next step was the subtraction of the quiet-Sun background emission. The quiet-Sun component was computed by performing successive parabolic fits of the digital data, as we had done with the 1980 RATAN observations (see Alissandrakis et al., 1993); in each iteration only points with intensity less than or equal to the corresponding values of the previous parabolic fit were taken into account. When no more data points were rejected, the computed quiet-Sun emission was subtracted from the scans.
In some cases, a residual background was present in the V scans even after the application of the method described in Section 2.3. The remaining background emission was subtracted by a linear fit of the V data far from active regions. Subsequently, the V scans were calibrated using the calibration factors found from the I data.
The study of the flux of the I and V local sources (after the corrections described above) as a function of the position angle shows that their flux decreased in some scans recorded at position angles far from the central meridian. The most serious problem seems to be that the flux of some V scans was quite different (by a factor of 2 or more) from the central scan of a given wavelength. This contradicts the results of the I data, despite the fact that we used the same calibration correction factors. The origin of this problem is not well known. Thus after background subtraction we computed once again the flux of the I and V scans. We compared the flux of each scan to the flux of the scan recorded at zero azimuth. If the difference between the flux of a given scan and the flux of the central scan was higher than 10%, then that particular scan was not taken into account for the map computation.
2.5. COMPUTATION OF A DIRTY MAP AND CLEANING
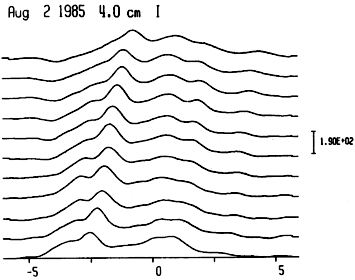
An inspection of Figure 2, where the corrected 4 cm I and V scans are displayed, shows that the position of the local sources changed from scan to scan due to the change of scan orientation during the observation. Thus the scans contained two-dimensional information about the local sources that can be recovered with the computation of two-dimensional maps. The maps can be calculated by means of Earth rotation aperture synthesis techniques.
After all corrections a dirty map was computed by combining the scans
at different position angles. Before applying the earth rotation synthesis
we shifted the icons to compensate for the effect of the differential rotation
of the Sun. We 'assumed a typical angular velocity for the Sun about 13'
per day and we computed the shifts of the scans of a given day by determining
the differences between their time of recording and the time of local transit.
Consequently, the shifts increased
 |
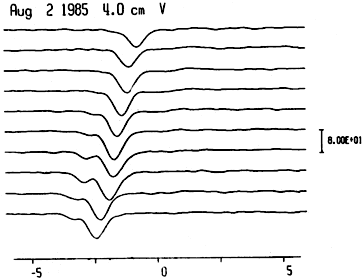 |
Fig. 2. The I and V scans in the vicinity of the active region at 4 cm for August 2, 1985 after all corrections. In the abscissa is the position (in arc min) in the east west direction. The intensity is in Jy arc sec
TABLE II
Resolution of RATAN maps
|
|
|
|
|
|
|
|
|
3.2 4.0 8.2 |
0.6 0.7 1.4 |
7.5 8.7 14.3 |
for scans recorded far from the local meridian. However the effect of solar rotation introduced only minor shifts (10" to 15") in the north south direction.
Our program created a grid with an east west length equal to the scan
length at zero position angle. The number of pixels in the north south
direction was the same as the number of pixels in the east west direction;
however, the north south pixel size was ten times bigger than that of
the east west direction. Then the entire grid was filled with the data
points from each scan, rotated by an angle equal to the scan position angle.
The position angle, t, of the scans was computed by the formula
|
|
(13) |
where A and 6 are the azimuth of the scan and the declination of the Sun, respectively. The value of the dirty map at a given grid point was the sum of the contribution of all scans at that particular point.
The same method was used for the computation of the dirty beam from the one-dimensional beam pattern of the RATAN-600, assuming that the beam pattern was the same at all position angles of the scans.
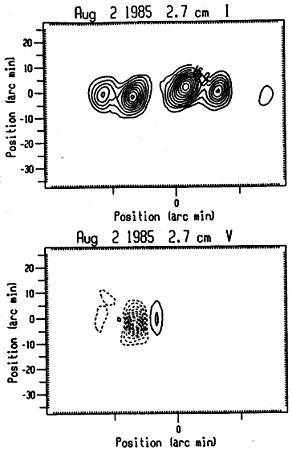
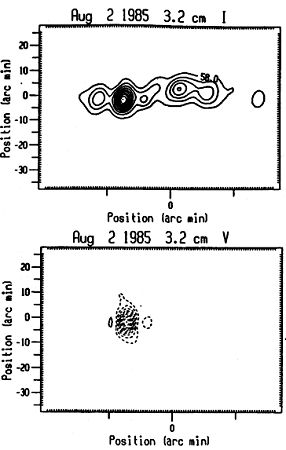
The last step of the processing was an attempt to free the dirty map of the sidelobes, using the standard CLEAN procedure. The resolution of the August 2 clean maps is shown in Table II. Above 8.2 cm, the two active regions present during the observations were not resolved, while at wavelengths from 0.8 cm to 2.3 cm the active region emission was nearly at the same level as the quiet-Sun emission. In Figure 3 we present the I and V CLEAN maps for August 2 at 2.7, 3.2, 4, and 8.2 cm.
During our observations, two active regions were present on the solar
disk. Active region NOAA 4862was located in the southern hemisphere of
the Sun and consisted of an axially symmetric preceding spot of negative
magnetic polarity and
 |
 |
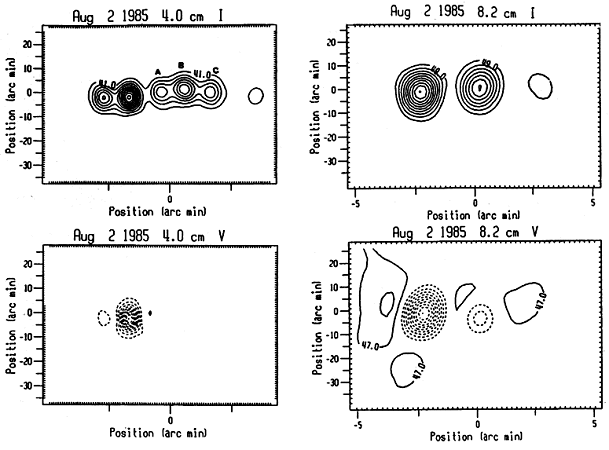 |
Fig. 3. I and V CLEAN maps for August 2, 1985 at 2.7, 3.2, 4, and 8.2 cm. Contour levels are in intensity (Jy arcsec ) steps of 10% of the absolute peak intensity. Dashed lines indicate left-hand circularly polarized emission. Note that the east-west scale is different from the north-south scale of the plots.
a well-developed bipolar magnetic structure. The orientation of
the dipole field of the region was highly inclined with respect to the
east west direction, being oriented almost north south. Active region
NOAA 4680 was located in the southern hemisphere of the Sun and consisted
of a prominent filament and a prominent plage. The preceding spot was visible
in Ha. on July 31 only and disappeared on August l.
The strongest component of the I scans (Figure 2) was associated with the sunspot of active region NOAA 4682. The part of the radio emission which was located to the west of that component was associated with active region NOAA 4680. The V scans (Figure 2) show that the sunspot component of active region NOAA 4682 was polarized in the left-hand sense while the northern active region was essentially unpolarized.
These active regions were also observed with the VLA (Alissandrakis, Kundu and Shevgaonkar, 1991) at 6 and 20 cm. At 6 cm the field of view was limited and only the sunspot-associated source of active region 4682 was observed; at 20 cm both active regions were observed.
Both active regions were mapped with the RATAN-600 (Figure 3). The emission associated with active region NOAA 4682 consisted of two components at 2.7, 3.2, and 4 cm, in accordance to the I corrected scans. The strongest of the two components was associated with the sunspot. The other component, which was located at the east of the sunspot-associated source, was associated with the plage. The 6 cm VLA maps showed no evidence for the presence of this component, contrary to the picture derived from the RATAN scans. Indeed, an inspection of the August 2, 4 cm I scans (Figure 2) shows that, in most of them, a component which was located towards the eastern direction with respect to the sunspot source, was present. Sunspot drawings obtained from Solnechnye Dannye show the existence of a small pore located nearly at the same place where the component under discussion appeared. Thus it is possible that the pore contributed to the emission
of that component as well. At 8.2 cm the active region emission consisted of one component due to the low resolution.
The part of the radio maps which was located to the west of the sunspot component of active region NOAA 4682 was associated with active region NOAA 4680. An inspection of the I RATAN maps shows that the northern active region emission consisted of two components at 2.7 cm and three components at 3.2 and 4 cm. The last result is in good agreement with the VLA observations of the same aclive region at 20 cm. Indeed, all three VLA sources where located within the bulk emission of the 3.2 and 4 cm RATAN sources A, H, and C (Figure 3). However, we would like to note that in some cases the north south position of the peaks of the
RATAN local sources was displaced with respect to the corresponding positions of the VLA peaks. The above displacement was of the order of a few seconds of are and its, origin was due to the very limited north south width of the angular, coverage provided by the scans. Alissandrakis, Kundu, and Shevgaonkar (1991) studied the association of these components with chromospheric features observed in Ha photographs and found that source B was located above the neutral line of the photospheric magnetogram near the tip of a long filament, in a region of strong magnetic field and strong magnetic field gradient. Components A and C were associated with the plage of the following and preceding polarity, respectively. At 8.2 cm the active region emission consisted of one component due to the low resolution.
The V maps show that the only source which was mapped with confidence was the one associated with the sunspot of active region 4682. The circular polarization of the northern active region was practically zero from 2.7 to 4 cm, in agreement with the V scans. However, the VLA maps indicated that at 20 cm the circular polarization of active region NOAA 4680 was higher. For example, the degree of circular polarization of source A on August 2 was of the order of 40%. The last result might be interpreted in terms of optically thin gyro-resonance emission from the third or the fourth harmonic of the gyro-frequency. Indeed, at 20 cm the third harmonic requires a magnetic field of 170 G, while the fourth harmonic requires 130 G. The photospheric magnetic field was around 1200 G, according to Solnechnye Dannye. We note that the components which corresponded to righthand circularly polarized emission (the western component of the 2.7 cm V map, the eastern, the middle and the western components of the 8.2 V map, see Figure 3) were not associated with real sources, but they were due to sidelobes which were, not possible to remove.
The RATAN maps can be used for the determination of flux from different local sources. We used two methods for the measurement of the source flux from the RATAN maps. In the first method, the flux was estimated by visual determination of the local source limits and subsequent integration. In the second, the flux of each source was computed by modeling the maps with two-dimensional gaussian-shaped sources. The two methods gave consistent results, within about 5%.
Figure 4 gives the flux spectra in right-hand circularly polarized intensity (R) and left-hand circularly polarized intensity (L) of the sunspot-associated source of active region NOAA 4682 for the period from July 31 to August 3. At 8.2 cm there might be some contribution to the emission from the plage. However, due to the low resolution of the 8.2 cm maps, the sunspot and the plage components were not resolved. Thus we tried to model the component of the 8.2 cm scans which was associated with active region 4682 with two one-dimensional gaussian-shaped sources: one for the sunspot-associated emission and the other for the plage-associated emission. We found that the sunspot flux was 80% of the total flux.
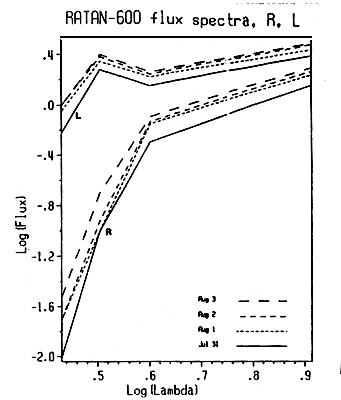
Fig. 4. Flux spectra in right-hand circularly polarized intensity (R) and left-hand circularly polarized intensity (L) of the sunspot-associated source of active region NOAA 4682, for July 31, August 1, 2 and 3, 1985. The abscissa is the logarithm of the wavelength in cm and the ordinate the logarithm of the flux in s.f.u.
The properties of flux spectra of sunspot-associated sources have
been interpreted in terms of gyroresonance emission from the low harmonics
of the gyro-frequency with the relative importance of free-free emission
increasing with wavelength (see Alissandrakis et al., 1993 for a
detailed discussion). Alissandrakis, Kundu, and Shevgaonkar, 1991 showed
that no inversion of the sense of circular polarization occurred above
the sunspot of region 4682; thus the R and L flux give the
emission of the source in' the ordinary and extraordinary mode, respectively.
At 2.7 cm there was some o-mode emission and significant e-mode emission;
the source was nearly 100% polarized. This shows that the third harmonic
of the gyrofrequency entered the TR at 2.7 cm. The e-mode flux increased
in the range of 2.7 to 3.2 cm, whereas the o-mode flux increased in the
range of 2.7 to 8.2 cm. Apparently, the values of the 4 cm L flux
are not reliable due to instrumental problems. We thus ignored them and
we interpolated between the 3.2 cm and the 8.2 cm flux in order to derive
further conclusions. Indeed, model computations of the microwave flux (Nindos
et
al., 1996) verified that the value of the 4 cm
e-mode flux lay between the computed 3.2 and 8.2 cm e-mode flux. Thus the third harmonic entered the TR at 2.7 cm and reached regions of small temperature gradient at around 4 cm, whereas the second harmonic entered the TR at around 3.2 cm. Combining these results we get a lower limit of 1300 G and an upper limit of 1700 G for the strength of the magnetic field at the base of the TR. In the low corona, Alissandrakis, Kundu, and Shevgaonkar (1991) estimated the strength of the magnetic field to be in the range of 600 G to 900 G.
A study of the time variations of the flux of the sunspot-associated source for a given wavelength shows that the flux increased from day to day. The flux is the integral of the intensity over the area of a source, therefore changes of the flux of a source can be due to a change of either quantity. In our observations, the sunspot was approaching the center of the disk, thus the heliocentric distance of the source decreased. However, we are not able to judge whether the flux changes were due to this effect or due to real intensity variations of the radio emission from day to day. Indeed, the study of Alissandrakis, Kundu, and Shevgaonkar (1991) indicates that changes in the active region emission did occur during the observations.
In Figure 5 we present the flux spectra of the components B and C of the northern active region emission in I. The source was practically unpolarized thus we give only the I flux spectra. We note that the flux spectra of both sources were almost flat in the range from 2.7 to 4 cm, whereas the flux of source B increased in the range of 4 to 8.2 cm. This effect is due to the fact that at 8.2 cm the resolution was poor and the components A, B, and C were not resolved. Thus the 8.2 cm flux came not only from source B but from the nearby plage as well. The flat form of the spectra from 2.7 to 4 cm and the fact that the circular polarization was very low in the entire range of 2.7 to 8.2 cm implied that the free-free emission dominated.
In order to model the emission of the components B and C we assumed that only the free-free process contributed. We used a simple model for the computation of the brightness temperatures at the observing frequencies and compared the results with the flux spectra derived from the RATAN maps. The model assumed that the radiation was emitted in a layer with a temperature of 10 K at the base of the TR and 2.6 x 10 K in the low corona and that the temperature and density were such that the ratio of the conductive flux F" to the square of pressure P0, was constant (for details see Alissandrakis, Kundu, and Lantos, 1980; Strong, Alissandrakis, and Kundu, 1984). Once the brightness temperatures have been computed the calculation of model flux is straightforward, provided that the source sizes are known. The source sizes were obtained by modeling the maps with two-dimensional gaussian shaped sources. The best-fit values of flux were obtained with P0 = 2.6 x 1015 cm - K and Fc = 6 x 10⁶ erg cm-2 s-1.
The above model reproduced in quite a satisfactory way the observed flux spectra of both sources. In Table III we list the model optical depths and brightness temperatures as well as the sizes of the August 2 local sources in the form of' the major and minor axes of the two-dimensional gaussian sources. We also give the model flux densities as well as the observed ones. Similar results were obtained for
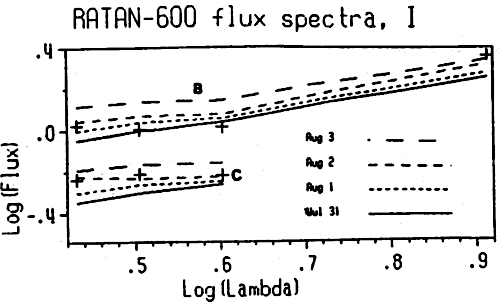
Fig. 5. Total intensity flux spectra of the components B and C of active region NOAA 4680 for July 31, August 1, 2, and 3, 1985. The crosses show the computed free-free flux for August 2, from a simple, constant conductive flux model. The abscissa is the logarithm of the wavelength in cm and the ordinate the logarithm of the flux in s.f.u.
TABLE III
Properties of components B and C
|
|
|
|
|
|
Model Tb | Model flux | RATAN flux |
|
|
|
(arc min) | (K) | (s.f.u.) | (s.f.u.) | ||
|
3.2 4.0 8.2 2.7 3.2 4.0 |
B B B C C C |
8.75 8.87 13.34 6.63 6.60 6.70 |
0.80 0.81 1.19 0.60 0.65 0.68 |
0.007 0.011 0.048 0.005 0.007 0.011 |
5.6 x 10^3 8.7 x 10 4 3.6 x 10 4 4.0 x 10 3 5.6 x 10 3 |
1.02 1.04 2.30 0.58 0.62 0.61 |
1.11
1.18 1.2 2.1 0.60 0.62 0.65 |
the entire observing period. The values of the model optical depth are very low, therefore there might be some contribution to the emission from layers which were located below the level of 10^5 K.
We also checked the above model against the 20 cm VLA observations. Due to calibration problems, Alissandrakis, Kundu, and Shevgaonkar (1991) presented the VLA maps in arbitrary units. We therefore calibrated the VLA clean maps by setting their tlux to the values derived from RATAN data. At 20 cm, the RATAN resolution was poor and the two active regions were not resolved; thus we used the
individual scans, after background subtraction, to get the active region flux. Our calibration for August 3 is in good agreement with that of Kundu, Schmahl, and Fu (1989), who calibrated independently the VLA maps of that day.
In order to reproduce the 20 cm VLA brightness temperature and flux of component B, our free-free model required implausibly high values of pressure (of the order of 2 x 10 cm K) which imply too high a density (of the order of 2 x 10^11 cm^-3 at the base of the TR). Consequently, the gyro-resonance mechanism or even non-thermal emission should be invoked to interpret the excess flux at 20 cm. The brightness temperatures and flux of source C at 20 cm required a pressure of 5 x 10 cm K. However, this value could not account for the flux densities of the same source at higher frequencies: it gave values greater by a factor of 3.5 than the observed. Thus, the picture which emerges is that at short wavelengths (2.7 to 8.2 cm) the free-free process dominated while at long wavelengths, around 20 cm, the contribution of the gyro-resonance process or non-thermal emission became important even for these plage-associated components.
In this work we presented for the first time two-dimensional maps computed from one-dimensional RATAN observations taking advantage of the capability of the RATAN-600 to provide scans at different position angles before and after the Sun's transit through the local meridian. This gives an angular coverage of nearly 14' width. The narrow angular coverage resulted in a rather low north south resolution. However, the use of the RATAN-600 as a mapping instrument is clearly an improvement over its use as a one-dimensional instrument. The main advantages are that the local sources of the radio emission are better resolved and the specification of their positions with respect to the solar disk can be done with less uncertainty.
We mapped two active regions which were present on the solar disk during the observing period. We computed maps at four wavelengths (2.7, 3.2, 4 and 8.2 cm) thus we were able to derive flux spectra of different local sources. We studied different types of local sources: a sunspot-associated source, a source which was located above the neutral line of an active region near a long filament, and a source which was associated with a plage. The emission mechanism of the sunspot-associated source was attributed to the gyroresonance process. From the identification of the harmonics which were responsible for the emission, we made a direct estimate of the magnetic field in the TR and the low corona: between 1300 and 1700 G at the base of the TR and between 600 and 900 G in the low corona. Thus the computation of RATAN maps at different wavelengths can help in the determination of the three-dimensional structure of the solar magnetic field.
The RATAN flux spectra of the other sources indicated that at short wavelengths (from 2.7 to 8.2 cm) the emission mechanism was the free-free process. Our model, which assumed that the temperature and density variations were such that the ratio of the conductive flux to the square of pressure was constant, reproduced in quite a satisfactory way the observed flux spectra of both sources at these wavelengths. However, implausibly high densities were needed in order to interpret the 20 cm VLA brightness temperatures of these sources in terms of the free-free process. This means that the gyro-resonance mechanism or non-thermal emission played an important role at 20 cm.
In the near future, observations of celestial objects with the RATAN-600 at different position angles are planned. The duration of these observations will be around 2 3 hours. Our method for the computation of maps will be useful not only for solar observations but also for observations of other celestial objects. Simultaneous VLA and RATAN-600 observations will be of great interest because the poor north south resolution of RATAN maps will be compensated in part by the VLA observations.
This work has been supported in part through the bilateral exchange agreement between Greece and Russia. The authors wish to thank V. E. Abramov-Maksimov and V. A. Shatilov for their contribution to the observations.
Akhmedov, Sh. B., Gelfreikh, G. B., Bogod, V. M., Korzhavin, A. N.:
1982, Solar Phys. 79, 41.
Akhmedov, Sh. B., Borovik, V. N., Gelfreikh, G. B., Bogod, V. M., Korzhavin,
A. N., Petrov, Z. E.,
Dikij, V. N., Lang, K. R., and Willson, R. F.: 1986, Astrophys.
J.
301, 460.
Alissandrakis, C. E., Kundu, M. R., and Lantos, P.: 1980 Aston.
Astrophys.
82, 30.
AIissandrakis, C. E., Kundu, M. R., and Shevgaonkar, R. K.: 1991,
Astron. Astrophys. 251, 276. "Alissandrakis, C. E., Gelfreikh, G. B.,
Borovik, V. N., Korzhavin, A. N., Nindos, A., and Kundu, M.
R.: 1993, Astron. Astrophys. 270, 509.
Bogod, V. M., Gelfreikh, G. B., Willson, R. F., Lang, K. R., Opeikina
L. V., Shatilov, V., Tsvetkov,
S. V.: 1992, Solar Phys. 141, 303.
Gelfreikh, G. B., Peterova, N. G., and Ryabov, B. I.: 1987, Solar
Phys. 108, 89.
Kundu, M. R., Schmahl, E. J., and Fu, Q.-J.: 1989, Astrophys. J.
336,
1078.
Kruger, A., Hildebrandt, J., Bogod, V. M., Korzhavin, A. N., Akhmedov,
Sh. B., and Gelfreikh, G-
B.: 1986, Solar Phys. 105, 111.
Lee Jeongwoo, W., Hurford, G. J., and Gary Dale, E.: 1993,
Solar
Phys. 144, 45.
Nindos, A., Alissandrakis, C. E., Gelfreikh, G. B., Kundu, M. R., Dere,
K. P., Korzhavin, A. N., and
Bogod V. M.: 1996, Solar Phys., in press.
Shevgaonkar, R. K. and Kundu, M. R.: l9S4, Astrophys. J. 283,
413.
Strong, K. T., Alissandrakis, C. E., and Kundu, M. R.: 19S4, Astrophys.
J. 277, 865
White, S. M., Kundu, M. R., and Gopalswamy, N.: 1992,
Astrophys.
J. Suppl. 7S, 509.