Abstract. An analysis of the local sources
(LS) structure of the S-component of solar radio emission confirms the
presence of a core component which is characterized by strong circular
polarization and a steep growing spectrum at shorter centimeter wavelengths.
These details coincide in position with the sunspots' umbra and their height
above the photosphere does not generally exceed about 2000 km. Gyroresonance
emission of thermal electrons of the corona is generally accepted as being
responsible for this type of emission. The spectral and polarization observations
of LS made with RATAN-600 using high resolution in the wavelength range
2.0 - 4.0 cm, allow us to measure the maximum magnetic fields of the corresponding
sunspots at the height of the chromosphere-corona transition region (CCTR).
This method is based on determining the short wavelength limit of gyroresonance
emission of the LS and relating it to the third harmonic of gyrofrequency.
An analysis of a large number of sunspots and their LS (core component)
has shown a good correlation between radio magnetic fields near the CCTR
and optical photospheric ones. The magnetic field in CCTR above a sunspot
is found only 10 to 20/ lower than in the photosphere. The resulting gradient
of the field strength is not less than 0.25 G km-1. This result
seems to contradict the lower values of magnetic fields generally found
above sunspots using the chromospheric Ha line. Some possible ways of overcoming
this difficulty are proposed.
1. Introduction
Observations made during the eclipses and interferometric measurements resulted in finding a complicated structure of LS of solar radio emission at microwaves (Korol'kov et al., 1959; Kundu, 1958). Among several components found in LS, the 'core component', which is observed as a group of bright sources situated above the sunspot umbra, is of special interest. It is clearly distinguishable in the short centimeter range of the spectrum. As a consequence, the radio image of a sunspot group is generally observed at these wavelengths as a negative picture of a photoheliogram of the same region in white light. This is especially pronounced in circularly polarized emission due to strong circular polarization (Korol'kov et al., 1960).
In spite of serious observational evidence in favour of gyroresonance emission of the above-mentioned core component (Gelfreikh et al., 1970), the dominant role of this mechanism is often argued as improbable (see, e.g., Shimabukuro et al., 1973). Having in mind the problems of the solar physics interpretation of the core of the LS using gyroresonance emission, one can see that low heights of the corona above sunspots are required, which do not exceed a few thousand kilometers (Livshits et al., 1966). This condition follows from the fact that magnetic fields of about 1000 G and more are necessary to give emission in the 3 cm wavelength range of the spectrum. At present we know that the low height (less than 2 or 3 x 10 km) is confirmed by the results of a number of solar eclipse measurements (Gelfreikh et al., 1970; Gelfreikh and Korzhavin, 1976; and others) though some contradictory evidence has been published (Donati Falchi et al., 1977; Eryushev et al., 1971). We show below that the evidence of low heights is also given by RATAN-600 observations for this component.
So far as the theory of the gyroresonance emission of the S-component determines the relation between the wavelength and the magnetic field strength, many authors have made attempts to find the magnetic field in the solar atmosphere by using this mechanism (Akhmedov and Peterova, 1973; Bogod and Korzhavin, 1975; Peterova, 1975; Pallavicini et al., 1979; Alissandrakis et al., 1980).
In this paper we develop a method based on measuring the shortest wavelength, at which the emission of the core component of LS could be detected. The measurements have been made by means of high-angular resolution observations with RATAN-600 (for a description of this instrument see Berlin et al., 1977) using detailed spectral and polarization analyses in the wavelength range from 2 to 4 cm.
We compared magnetic fields of sunspots determined by this method with optical magnetic measurements of the same sunspots (after the bulletin Solnechnye Dannye) and found a good correlation (r = 0.81). The radio magnetic fields were found to be only about 20/ lower than the optical photospheric ones. This suggests that such strong magnetic fields as 2000 G and higher can penetrate into the corona above a sunspot.
2. Core Component of LS
Observations made with high-resolving power display the multi-component structure of LS. The components differ in characteristic dimensions, coordinates relative to optical features, spectra and the degree of circular polarization. Here, we call attention to the so-called sunspot core component which is most evidently observed in each LS above every sunspot (with an area of more than 50 millionths of the hemisphere).
The main properties can be summarized as follows:
(2) The high degree of circular polarization amounting to about 100/ (at least in a narrow wavelength band). Due to higher contrast of the component in polarized emis sion, the polarized radio image becomes similar to the negative picture of the white-light image of a sunspot group (with the exception of some smaller sunspots).
of the magnetic field, an extraordinary magneto-ionic theory mode being in excess.
This suggests that a sunspot of N-polarity has an excess of right-handed polarization and vice-versa. Some sunspots may, however, happen to have an opposite sign of polarization due to such effects, as the propagation condition and the reversed gradient of the temperatures.
(4) The height of the generation region is usually not higher than 3000 km above the photosphere and possibly less. Although some radio cores extend beyond the umbra of the sunspot, these shifts do not generally correspond to the expected projection effect of the height extension of the source.
Recently, large interferometers were used to construct radio images of some active regions with the resolution of several seconds of are (Felli et al., 1975; Kundu et al., 1977; Palavicini et al., 1979; Lang and Wilson, 1979). These observations confirmed relatively small sizes of the core of LS (15 - 30 are sec), strong polarization of radio radiation amounting to 80/ at 6 cm, and high brightness temperatures. A detailed spectral and polarization analysis of LS proved possible when commencing solar observations using RATAN-600, though the resolving power of the radiotelescope is limited to some tens are seconds for centimeter wavelengths. Such study has been started in the wavelength range from 2 to 4 cm, where an abrupt change of the flux densities was previously registered using LPR (Gelfreikh et al., 1970). Zheleznyakov (1962) and Kakinuma and Swarup (1962) have shown the possible role of gyroresonance emission for the generation of radio radiation of solar active regions which should be taken into account while interpreting the S-component radio emission of the Sun. The model computation and considerations of its physical significance were made by a number of authors (Zlotnik, 1968a, b; Lantos, 1968; Gelfreikh and Lubyshev, 1979). Zheleznyakov (1963) proposed to identify with gyroresonance emission not the whole source of the S-component, but only the bright central part of LS found by Kundu (1958) using the two-element interferometric technique. We attempt to identify with this mechanism only a limited portion of the bright part of the source connected with sunspot groups, which we call radio cores and which are described above. These cores are strongly polarized and situated exactly above the spots, while within the region of the sunpot groups they are generally observed by some other sources of radio radiation with different properties (Korzhavin, 1979).
3. Methods of Observations
The south sector with the periscope of RATAN-600 was used in these observations. The HPBW of RATAN-600 for this case (in horizontal and vertical directions) are given in Table I.
TABLE I
The HPBW of the RATAN-600 used in the observations
| Wavelength(cm) | 2.0 | 2.3 | 2.7 | 3.2 | 4.0 |
| HPBW | 17"x13' | 19"x15' | 23"x18' | 27"x21' | 34"x26' |
The observations were made once a day near the moment of culmination, using five polarimeters (Bogod et al., 1976) at the wavelengths 2.0, 2.3, 2.7, 3.2, and 4.0 cm. All polarimeters measure both intensity I = (TRA + TLA)/2 and the difference of right-handed and left-handed circularly polarized signals V = RA + TLA simultaneously.
The noise level of the receiver system is low enough to have fluctuations at the output only due to the signal of the Sun.
The data published in the bulletin Solnechnye Dannye and the photoheliograms obtained at the Kislovodsk mountain station were used to identify the LS with sunspots and to find their optical parameters. Antenna temperatures were corrected for aberration losses due to shifting of the feed horns out of the focus and for the dependence of the effective antenna area on the wavelength. The appropriate coefficients and beam widths were measured using the cosmic point sources 3C273 and 3C84 as well as the Omega and the Crab nebulae. Solar radiometers were used in these observations.
For this study, the LS above sunspots were chosen following the criterions: (i) the sources are associated with either single sunspots or with spots of bipolar groups well separated in longitude, (ii) the sources are situated either in the center or in the east part of the solar disc, in order to avoid the effect of depolarization in quasi-transverse magnetic fields of the solar corona (see Cohen, 1958; Peterova and Akhmedov, 1973).
4. The Method of Magnetic Field Measurements
The following method can be proposed to determine the maximum magnetic field strength of a sunspot at the level of CCTR, if the properties of their gyroresonance emission are taken into account.
The main idea of the method is to find from observations the shortest ('limiting') wavelength, where the gyroresonance emission can still be detected. This wavelength is related to emission of the third harmonic of gyrofrequency and so related to the magnetic field strength in accordance with the theory and model estimates for gyroresonance generation of the radio emission above sunspots.
The appearance of gyroresonance excess emission is due to the presence of 'hot' electrons, so this estimation of the magnetic field should be referred to the base of the corona or possibly to the CCTR above the sunspot.
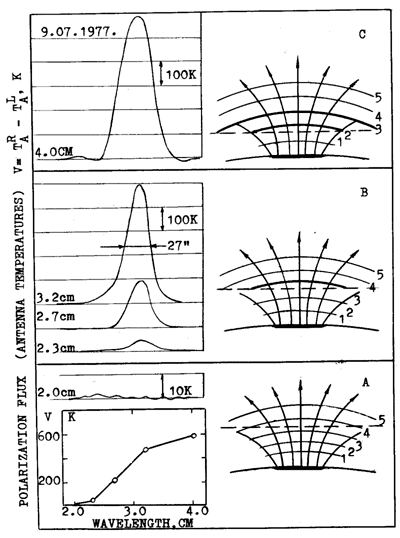
We illustrate the method by the observation of a source with distinct properties of gyroresonance generation of radio emission (see Figure 1).
The spectrum of polarized flux of the LS of the sunspot group No. 68 (S21, E20 according to Solnechnye Dannye) is shown in the left-hand part at the bottom for

Fig. 1. The records of circular polarization V at five wavelengths from 2.0 to 4.0 cm (on the left) for the LS above the sunspot group No. 68, July 9, 1977 (S 21, E 20). On the right, the model of LS in solar atmosphere according to Zheleznyakov (1962, 1963). Dotted lines determine the CCTR. Number 1 and 5 are harmonics of gyrofrequency.
9 July, 1977. The limit wavelength of the source is
l
= 2,3 cm, where circularly polarized emission is still detectable. However,
polarized emission is definitely absent at the shorter wavelength l
= 2.0 cm (in spite of the scale of the record being increased ten times!).
On the other hand, we have a fast growth of the polarized flux with wavelength and then this growth slows down producing a flat part of the spectrum. The source size seems to increase with wavelength (the angular size at 3.2 cm does not exceed the HPBW, while at 4.0 cm it is as large as 1.3 times the size of the HPBW). The sign of polarization (right-handed) is in accordance with the excess of the extraordinary mode, while the degree of polarization amounts to 90 - 100/ at 2.3, 2.7, and 3.2 cm. At the left-hand side of Figure 1, the curves of polarization records are given, the intensity curves being omitted for the sake of simplicity. All these properties of the source can be realized in terms of gyroresonance emission (see model computations by Zlotnik, 1968a, b).
The above-mentioned model computations show that for a 'typical' sunspot with a dipole structure of the magnetic field, the gyroresonance absorption at the levels of the first three harmonics of the gyrofrequency is high, so the effective temperature of gyroresonance emission is determined in full by the kinetic temperature at the level of a gyroresonance layer. The optical thickness is two orders of magnitude higher for the extraordinary mode, compared with the ordinary one. On the other hand, the layer effectively emitting an extraordinary mode (s = 3) is generally higher above the sunspot than that of s = 2 responsible for the emission of an ordinary mode.
For any particular sunspot we can consequently find such
a wavelength range for which the layer s = 3 is already in the region of
the high coronal or subcoronal temperature with T = 10' - 10 K, while the
layers = 2 is in the chromosphere temperature region with T = 10 K (assuming
that the CCTR is not too extended compared with the size of sunspot). Under
these conditions the radiation is practically generated only at the level
of the third harmonic of gyrofrequency and has nearly 100% polarization
in accordance with the excess of the extraordinary mode. The ratio of the
boundary wavelengths of this range is ~ consistent with the harmonic number.
The short limit of the wavelength range is connected with the magnetic
field at the 'base' of the corona by relation (s = 3)
| 3570 | |||
| H = | ------- | - (gauss) | (1) |
| l(cm) |
which is used to measure the magnetic field of sunspot in this work.
One practicaly must have at least two or three points in the wavelength range mentioned above to find 2.. A minor role of emission at the level of the fourth harmonic of gyrofrequency was neglected here.
The method developed here is illustrated in Figure 1. The qualitative pictures of the model assumed are given on the right for different positions of the second and third gyroresonance levels and the corresponding polarization records of a sunspot group obtained with the RATAN-600 are shown on the left.
Case (A) demonstrates the situation when both the 2-d and 3-d gyrolevels are in the chromosphere where their mean temperatures are nearly equal and rather low, and there is no excess of emissions both in polarization and in intensity.
Case (B) illustrates the range of the spectrum characterized by an abrupt increase of flux density with increasing wavelength. The width of this range as suggested above and following from observations is 3/2 (wavelengths 2.3, 2.7, and 3.2 cm being used for observations).
The 3-d gyroresonance level shifts to higher temperatures of the atmosphere presumably with T - 10 K and the 2-d level is still in the chromosphere with T ~ 106 K. The observed degree of polarization is P = (50 - 100)% and the extraordinary mode is in excess.
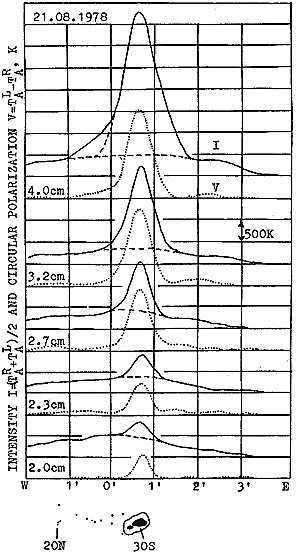
Fig. 2. The records of the LS above the sunspot group No. 223, August 21, 1978 (S 19, W02). The optical picture in the white light using the Kislovodsk station data is shown at the bottom.Case (C) represents the situation when both levels under consideration reach the coronal temperature region and, accordingly, the difference of right-handed and left handed emission stops growing and even begins dropping.
Following the results of EUV observations (Simon and Noyes, 1972) and some microwave data (Gelfreikh and Nefedyev, 1975) we suggest that the thickness of the transition zone is not great and does not exceed some thousands km.
Figure 2 gives an example of the record of the LS corresponding to sunspot group No. 233 situated near the central meridian at j = 19 S on 21 August, 1978. This is a medium-size group with an area of 274 m.h. (millionths of the hemisphere) and with a dominating leading spot. Small pores of the part following the leading spot do not appear on the records of polarization, except at longer wavelength of 4.0 cm. Nevertheless, in intensity curves asymmetry is due to the emission of this following part of the group. On the other hand, at the shortest wavelengths the leader is barely seen in the intensity record while being the dominant feature in the polarization record. One can see a fast growth of polarized signal with an increasing wavelength up to 3.2 cm. But at 4.0 cm it goes up much slower. At the same time the growth of the flux with wavelength is s.en over all the wavelength range. The sign of polarization gives an excess of an extraordinary mode. The size of the polarized source is practically that of the antenna beam resulting in the small size of the leader source (£ 15 are sec at 2.0 cm). The magnetic field strength for optical observations is given in hundreds of gauss.
Figure 3 shows spectral characteristics of the source. The degree of its polarization amounts to a high value of P = (90 - 100)% at shorter wavelengths and decreases to
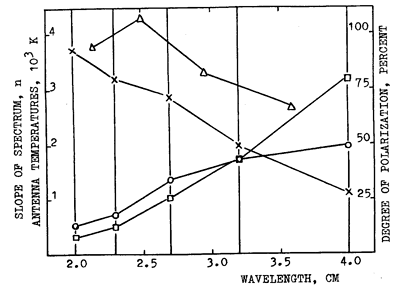
Fig. 3. Spectral curves for the core component of the LS above the sunspot group No. 223, August 21, 1978. The solid curve, marked by circles, corresponds to the spectrum of circular polarization V = (TRA - TLA). The solid curve, marked by squares, corresponds to the spectrum of intensity I = (TRA + TLA)/2. The curve of spectral index n(l) is marked by triangles and the degree of circular polarization is marked by crosses.
l = 4.0 cm. The slope of
the spectrum also reaches its maximum at shorter wavelengths (l
= 2.5 cm).
An example of the record of an active region spotted near the solar meridian on 2 May, 1979 and consisting of two dominating bipolar sunspots (sunspot group No. 193), is given in Figure 4. These spots were separated by 15o in longitude and there were some pores in the gap between them. The area of the sunspot group was 880 m.h. while each sunspot had an area exceeding 400 m.h. The active region latitude was 15o N.
One can see that in an intensity record (solid line) the sources are of a complicated structure, including a floccular componant, and coronal condensations etc. These are
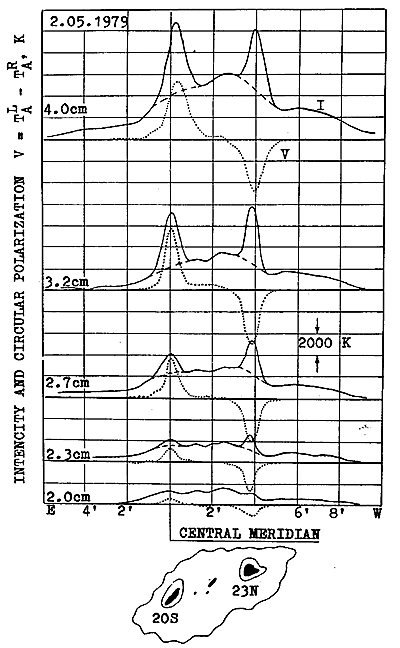
Fig. 4. An example of the records of an active region at five wavelengths from 2.0 to 4.0 cm in intensity and circular polarization. The optical picture of the sunspot group No. 193, May 2, 1979 (N 15, E 05) according to optical data of Solnechnye Dannye is shown at the bottom.
not analyzed here. At the wavelength l
= 2.0 cm, but not at the longer one, the details of LS due to sunspots
are not distinguishable in the intensity record, while in the polarization
records these spot features appear distinctly at all wavelengths. It is
possible to estimate the magnetic field simply by comparing the records
at all wavelengths and by looking for the cores due to gyroresonance emission.
However, the ratio of adjacent wavelengths is about 1.15 and the accuracy
of such magnetic-field determination will be 15%.
A better accuracy, however, could be gained if one plotted the polarized flux (measured in antenna temperature) versus wavelength for the source under investigation. Then extrapolating the curve to the zero V-value one gets lc, and consequently the magnetic field according to formula (1). This procedure is illustrated by Figure 5. The relation of scales l, and H used are also given by formula (1). The radio strengths of magnetic fields for the N-spot appeared to be 1930 G and 1700 G for S-spot. Optical measurements have given 2300 and 2000 G for the same spots, respectively.
Examples of a number of spectra of LS and their magnetic field measurements at radio waves are given in Figure 6 and some data concerning them are presented in Table II.
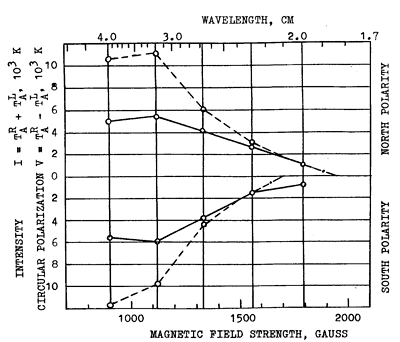
Fig. 5. Spectra of intensity (dashed curve) and circular polarization (solid curve) for two large spots of the sunspot group No. 193, May 2, 1979. Extrapolation of the circular polarization spectrum to the zero line determines the magnetic field strength. Here, the magnetic field is 1930 G for the north polarity source and the same is 1700 G for the south polarity source.
TABLE IIFig. 6. Examples of determining the magnetic field strength for different sources. The scale of the magnetic field is linear, and the wavelength scale is determined as l (cm) = 3570/H (G). The spectra of polarization are shown each in different scale: circles - the scale coefficient is 10, triangles - 100, squares - 200. The spectral curves of this figure compared with the optical measurements are shown in the Table II.
Optical and radio measurements of sunspot magnetic field
strength
| Spectral curve number in Figure 6 | Sunspot group No.according to Solnechnye Dannye | UT and data
of the optical observationsa |
Sunspot group coordinates | Optical magnetic field strength (G) | Radio magnetic field strength (G) | ||
| h | m | day/month/year | |||||
| 1 | 85 | 6 | 30 | 18.08.1977 | N22,E32 | 1300N | 1470Nb |
| 2 | 81 | 6 | 30 | 18.08.1977 | N28,E02 | 1900N | 1510Nb |
| 3 | 92 | 6 | 36 | 29.08.1977 | S31,E29 | S | 1460S |
| 4 | 111 | 4 | 06 | 3.10.1977 | N21,E24 | 2300N | 1900N |
| 5 | 112 | 8 | 40 | 2.10.1977 | S19,E27 | 2000S | 1420S |
| 6 | 25 | 7 | 00 | 6.02.1978 | N20,E28 | 2000S | 1430S |
| 7 | 51 | 4 | 10 | 10.03.1978 | N16,E04 | 2800N | 2200N |
| 8 | 56 | 4 | 50 | 13.03.1978 | E31,E39 | 2100S | 1970Sc |
| 9 | 28 | 7 | 00 | 6.02.1978 | N15,E75 | 1800N | 1550N |
Here, we must illustrate some limitations of the method due to spectral pecularities both in shorter and longer parts of the spectra (see Figure 7).
The LS of sunspot group No. 99 on April 24, 1978 (Figure 7a) has the spectrum in the form of a straight line, which can be readily extrapolated to the zero level of V(l), resulting in H = 1370 G.
On the other hand, the spectrum for sunspot group No. 23 on February 6, 1978 in the same Figure 7a shows a relatively flat region in the range 2.0 - 2.7 cm. This is probably due to thermal bremsstrahlung of some hot condensed gas above the sunspot, resulting in a break of the slope of the curve. Extrapolation of the steep and straight part of the curve to the limit with V = 0 gives H = 1430 G, while its extrapolation to the level of bremsstrahlung emission results in H = 1340 G. This discrepancy gives some idea of the value of uncertainty of the method due to the superposition of various mechanisms of generation of the radio radiation, though this discrepancy is not too high (about 100 G).
Figure 7b represents an example of the LS of a large sunspot (group No. 51 March 12, 1978 N 16, W25 and Sp = 427 m.h.) with strong magnetic field. In this case our 'magnetograph' is off scale. However, the extrapolation of the spectrum to V = 0 level gives H = 2050 G. It is interesting to note that a bend of the slope at 2.7 cm, which presumably is due to the second harmonic emission, gives a similar value of magnetic field
H = 2230 G (from condition w = 2wH). This (probably with lower accuracy) is in reasonable agreement with the H = 2050 G referred to above. Another possible reason of decreasing polarized flux with wavelength l, is the effect of depolarization and the change of the sign while the wave is propagating across the transverse magnetic field region.
Finally, Figure 7c demonstrated an example, when both short-wave and long-wave bands are present in the same record in the wavelength range used (that is from 2.0 to 4.0 cm).
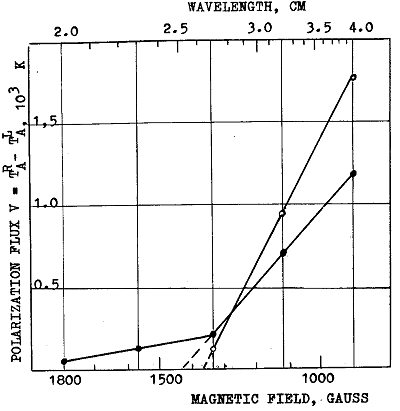
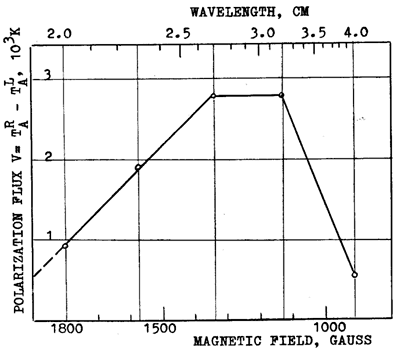
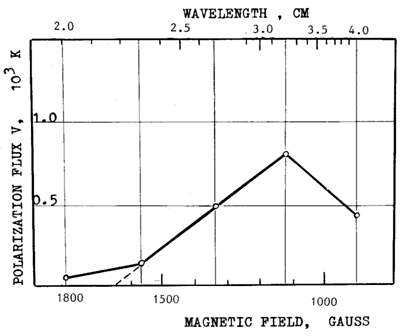
Fig. 7a - c. Different types of circular polarization spectra of the LS cores. (a) The spectrum V(l) for the is determined by extrapolation of the spectrum to V = 0 level and equals to 1370 G. This is an example of a small spot with the area of Sp=50m.h. The spectrum V(l) for sunspot group No. 23, February 6, 1978 (S 29, E 12), marked by full circles, has a bend. In this case the magnitude of magnetic field also is determined by extrapolation of the sharp part of the spectrum to V = 0 level and equals to 1430 G. (b) The spectrum V(2) for sunspot group No. 51, March 12, 1978 (N 16, W 25). The area of spot is 427 m.h. The extrapolation to V = 0 level gives H = 2050 G. (c) The spectrum V(l) for sunspot group No. 28, February 6, 1978 (N15, E75) has two bends.
The above examples of determining the magnetic fields
of sunspots by radio methods show that the main source of uncertainty often
lies in complicated nature of the spectra of some cores of LS. The difficulty
of differentiating between gyroresonance emission and probably bremsstrahlung
above the same sunspot results in an uncertainty of about 100 G. The error
of signal measurement amounting 10 to 20/ and separation between adjacent
wavelengths (about 15/) gives minor error due to the empirical fact that
essential points in determining the field are generally well fitted by
a straight line.
5. Discussion
We have plotted optical magnetic fields measured at the photospheric level (using the data of the bulletin Solnechnye Dannye) versus magnetic fields found from our observations with RATAN-600 (see Figure 8). The regression line of this plot (computed from 29 points of measurements) appeared to be
Hopt = 90 + 1. 19Hrad
.
(2)
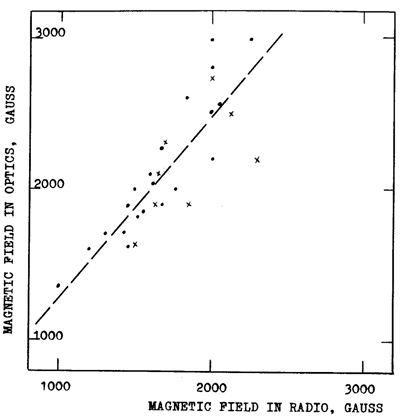
Fig. 8. Comparison of the radio and optical measurements of the sunspot magnetic fields. For the optical magnetic fields the data of the bulletin Solnechnye Dannye were used. Points - north polarity magnetic fields, crosses - south polarity magnetic fields. The dotted line determine the linear regression Hopt =90 + 1.19 x Hrad, with correlation coefficient r = 0.81 +- 0.07.
The correlation coefficient is r = 0.8 +- 0.07. Figure
8 shows quite a satisfactory agreement of the radio and optical measurements.
This confirms that both of them have physical significance.
The average radio magnetic field strength to the optical one shows that the decrease of the magnetic field of a sunspot from the photosphere to the boundary of corona is only about 20% . So the field at the level of CCTR must often exceed such a high value as 2000 G. Such a small decrease of the field with height may suggest either a low vertical gradient of the magnetic field or a very low position of the corona above a sunspot.
The latter possibility was proposed and discussed by Livshits et al. (1966), though only very limited observational data were then available.
As was mentioned before, a number of eclipse observations have shown a low height of radio cores above the photospheric sunspots that do not exceed 2000 km or less. One can draw a similar conclusion from observation made with the RATAN-600. A good example of these is a local source observed on the East limb of the Sun on July 20, 1977 (see Figure9). The LS has generally a very complicated structure along its height (Korzhavin, 1979). However, its core is clearly distinguished: it is strongly polarized and
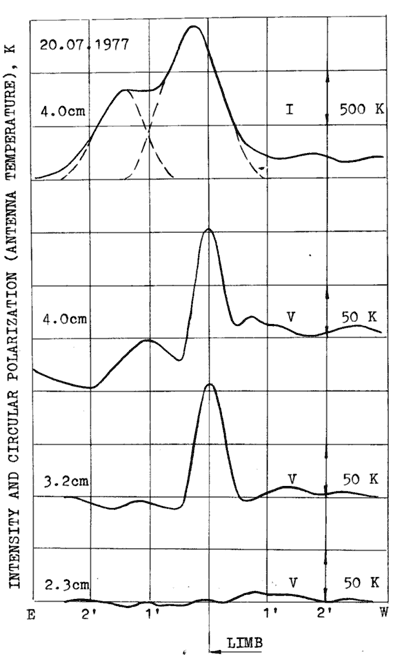
Fig. 9. The picture of an emerging LS at the east limb connected with the sunspot group No. 7 July 20, 1977 (N 16, E 90). The spot longitude is equal to 90 E from the central meridian and its declination is equal to that one of the solar disc center. Narrow source of gyroresonance emission is picked out only in circular polarization at wavelengths 4.0 cm and 3.2 cm. The position of this source coincide with the solar limb (and sunspot) position with an accuracy +- 1500 km. On the contrary, the picture in intensity at the wavelength 4.0 cm do not show such a narrow picked out source, but shows rather complicated structure of the LS distributed up to 105 km in height. The absence of circular polarization signal at wavelength 2.3 cm can be explained either by the position of the 3-d gyroresonance level for this wavelength in the chromosphere or, more likely, by screening in circumjacent layers of solar atmosphere.
practically coincides in the position with the optical
spot within +- 1500 km at 3.2 and 4.0 cm. From the above heights of generation
of radio emission and magnetic field strengths found, we obtain the gradient
of magnetic field above the sunspot equal to or greater than 0.25 G km-1.
On the whole, this value is consistent with the values found from optical
estimates of the field from different spectral lines. At the same time
radio measurements of the field are in obvious contradiction with optical
data obtained from measurements in the chromospheric hydrogen line H a
(see, e.g., Abdussamatov, 1978; Gussejnov, 1978). Even for large sunspots
the observers found a magnetic field strength of only about 1600 G, which
is definitively lower than the radio value of about 2000 G for sunspots
with 2500 G at the photospheric level. At the moment, however, it seems
impossible to rely on H magnetic field measurements due to serious uncertainties
inherent in this method.
Synchronous observations of the same sunspots by radio and optical methods using several lines originating at different heights are extremely desirable for the full picture of height distribution of the magnetic field above a sunspot. EUV images of the same spot would be of great value.
Acknowledgements
The authors are grateful to Yu. N. Parijskij and D. V. Korol'kov for support in fulfilling the observations on RATAN-600 and to S. I. Boldyrev, I. A. I. Ipatova, and A. F. Smirnov for help in observations. We are thankful to M. N. Gnevyshev for photoheliograms obtained at Mountain Astronomical station at Kislovodsk.
References
Abdussamatov, H. I.: 1978, Solnechnye Dannye No.
3, 95.
Akhmedov, S h.B., Bogod, V. M., Boldyrev, S. I., Gelfreikh,
G. B., Ipatova, I. A., and Korzhavin, A. N.: 1976, in Physics of the
Sunspots, Proceedings of the VIII Consultation on Solar Physics, Nauka,
Moscow, p. 153.
Akhmedov, Sh. B. and Peterova, N. G.: 1973, Izv. VUZ-ov,
Radiofizika 16, 1830.
Alissandrakis, C. E., Kundu, M. R., and Lantos, P.: 1980,
Astron.
Astrophys. 82, 30.
Berlin, A. B., Esepkina, N. A., Zverev, Yu. K., Kajdanovskij,
N. L., Korol'kov, D. V., Kopylov, A. I., Korkin, E. I., Parijskij, Yu.
N., Ryzhkov, N. F., Soboleva, N. S., Stotskij, A. A., and Shivris, O. N.:
1977, Pribory i Technika Experimenta, No. 11, 93.
Bogod, V. M. and Korzhavin, A. N.: 1975, Astrofiz.
Issled. (Izv. SAO) 7, 121.
Bogod, V. M., Boldyrev, S. I., Ipatova, I.A., Korol'kov,
D.V., and Romantsov, V. V.: 1976, Solnechnye Dannye No. 11, 93.
Cohen, M. H.: 1958, Proceedings IRE 46, 172.
Donati Falchi, A., Felli, M., Pampaloni, P., and Tofani,
G.: 1978, Solar Phys. 56, 335.
Eryushev, N. N., Tinin, M. V., and Tsvetkov, L. I.: 1971,
Izv.
Krymsk. Astrofiz. Obs. 43, 3.
Felli, M., Tofani, G., Fiirst, E., and Hirth, W.: 1975,
Solar
Phys. 42, 377.
Gelfreikh, G. B. and Korzhavin, A. N.: 1976, in Physics
of the Sunspots, Proceeding of the VIII Consultation on Solar Physics,
Nauka, Moscow, p. 94.
Gelfreikh, G. B. and Lubyshev, B. I.: 1979, Astron.
Zh. 56, 562.
Gelfreikh, G. B. and Nefed'ev, V. P.: 1975, Pis'ma
v Astron. Zh. 1, 32.
Gelfreikh, G. B., Akhmedov, Sh. B., Borovik, V. N., Gol'nev,
V. Ya., Korzhavin, A. N., Nagnibeda, V. G., and Peterova, Vi. G.: 1970,
Izv.
Glavn. (Pulkovo) Astron. Obs., No. 185, 167.
Gelfreikh, G. B., Korzhavin, A. N., and Shemyakin, G.
F.: 1972, in Radioastronomical Observations of the May 20, 1965,
Solar Eclipse, Nauka, Moscow, p. 50.
Gusseynov, M. Y.: 1978, Izv. Krymsk. Astrofiz. Obs.
58,
31.
Kakinuma, T. and Swarup, G.: 1962, Astrophys. J.
136, 975.
Korol'kov, D. V., Soboleva, N. S., and Parijskij, Yu.
N.: 1958, Solnechnye Dannye No. 9, 65.
Korol'kov, D. V., Soboleva, N. S., and Gelfreikh, G.
B.: 1960, Izv. Glavn. (Pulkovo) Astron. Obs., No. 614,81.
Korzhavin, A. N.: 1979, Candidate dissertation, Pulkovo,
Leningrad.
Kundu, M. R.: 1958, Compt. Rend. Acad. Sci. Paris
246, 2740.
Kundu, M. R., Alissandrakis, C. E., Bregman, J. D., and
Hin, A. S.: 1977, Astrophys. J. 213, 278.
Lang, K. R. and Willson, R. F.: 1979, Nature 278,
24.
Lantos, P.: 1968, Ann. Astrophys. 31, 105.
Livshits, M. A., Obridko, V. N., and Pikelner, S. B.:
1966, Astron. Zh. 43, 1135.
Nagnibeda, V. G.: 1968, in K. O. Kiepenheuer, 'Structure
and Development of Solar Active Regions', IAU Symp. 35, 575.
Pallavicini, R., Vaiana, G. S., Tofani, G., and Felli,
M.: 1979, Astrophys. J. 229, 375.
Peterova, N. G.: 1975, Astrofiz. Issled. (Izv. SAO)
7, 134.
Peterova, N. G. and Akhmedov, Sh. B.: 1973, Astron.
Zh. 50, 1220.
Shimabukuro, F. I., Chapman, G. A., Mayfield, B. E.,
and Edelson, S.: 1973, Solar Phys. 30, 163.
Simon, G. W. and Noyes, R. W.: 1972, Solar Phys.
22, 450.
Zheleznyakov, V. V.: 1962, Astron. Zh. 39, 5.
Zheleznyakov, V. V.: 1963, Astron. Zh. 40, 829.
Zlotnik, E. Ya.: 1968a, Astron. Zh. 45, 310.
Zlotnik, E. Ya.: 1968b, Astron. Zh. 45, 585