1 MAGIC description
The MAGIC device is a multi-mode focal
reducer, allowing flexible response to changing weather conditions due to
several observational modes: direct images, polarimetry and long-slit
spectroscopy. MAGIC is installed in the Cassegrain focus of the 1-m Zeiss-1000
telescope (see Fig. 1). The weight of the device without a CCD detector is
23 kg, and the size is 430x440x265 mm.
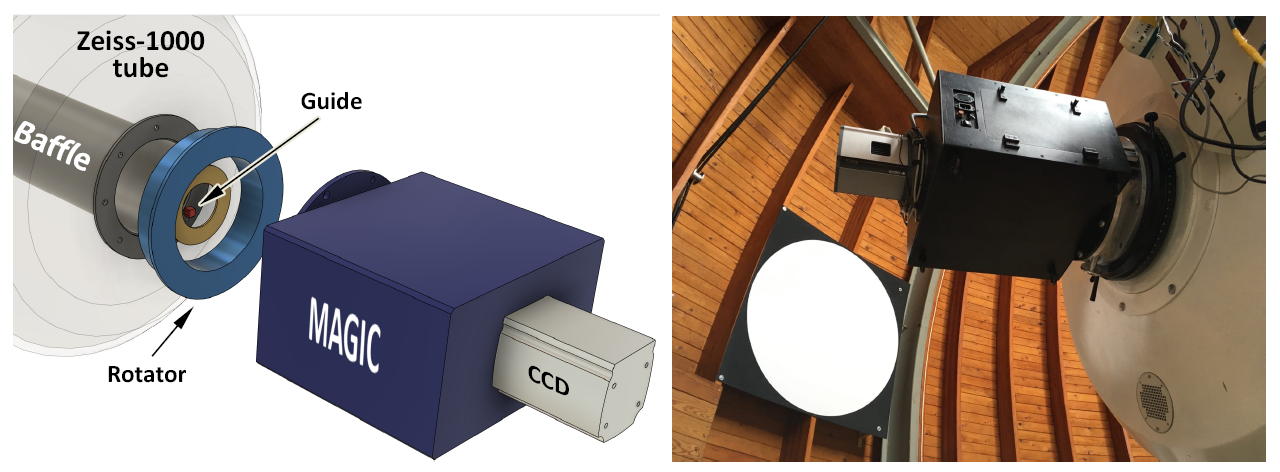
Fig. 1 MAGIC in the Cassegrain focus. Left: An illustrative scheme with a transparent telescope tube.
Right: photo of MAGIC and a FLAT circle in the
background.
The device is designed for an
input aperture ratio of F/12.5 and, due to the collimator and camera, increases
it to F/6.1, that solves the problem of oversampling for typical modern CCDs in
the focus of Cassegrain telescopes and provides an advantage for observing
faint extended objects.
Optical design
The optical part of the MAGIC focal
reducer consists of a field lens, a collimator and a camera lens. The scheme is
shown in Fig. 2.
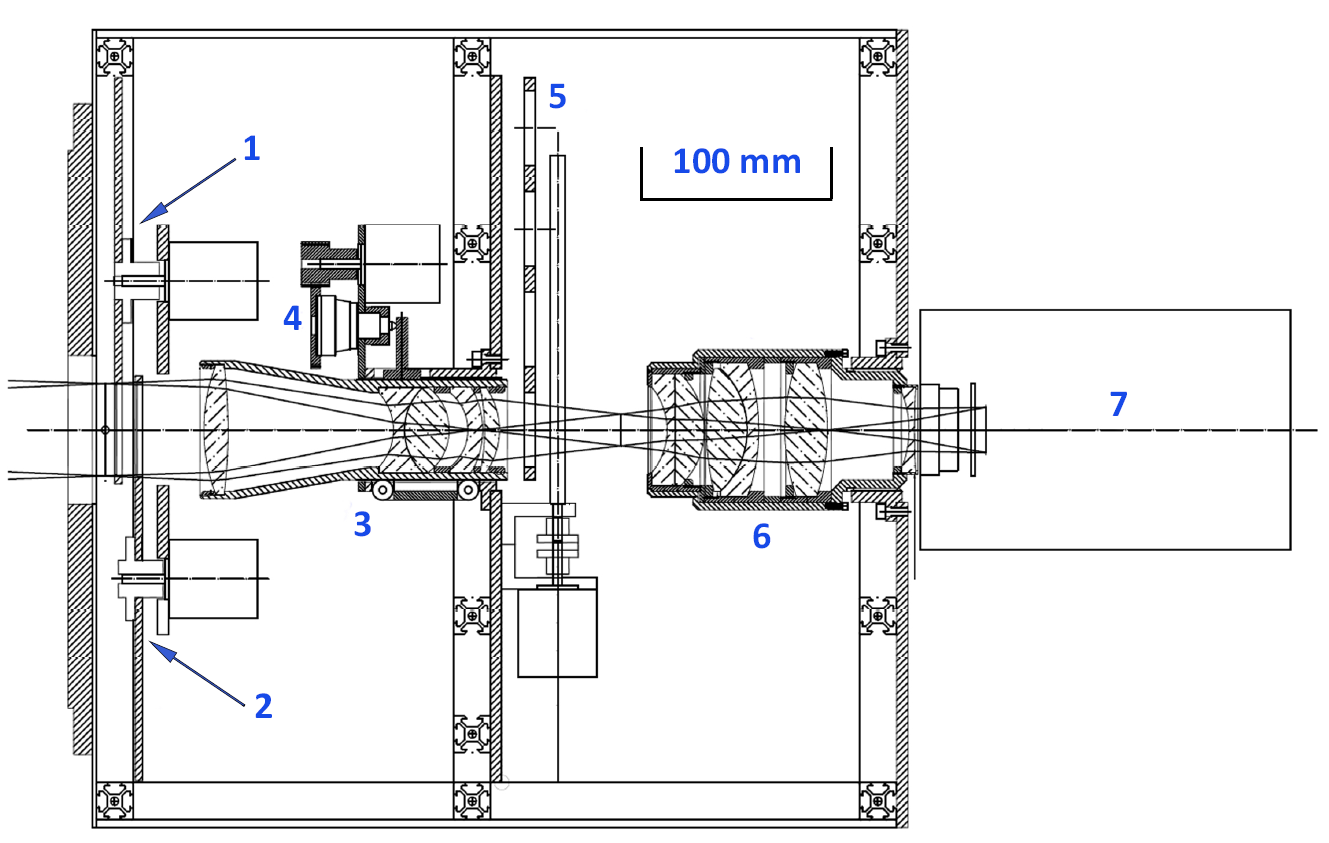
Fig. 2 MAGIC contents: (1, 2) — filter
wheels; (3) — collimator; (4) — focusing mechanism of the collimator; (5) —
mode changing linear guide carriage; (6) — camera; (7) — the CCD detector.
The collimator is a 5-lens apochromat
with a focal length of 220 mm and forms the exit pupil of the system. The
camera lens is a 6-lens apochromat with a focal length of 109 mm, which focuses
the resulting image on the CCD detector. All optical surfaces have an
anti-reflective coating, which ensures transmission of the each lens >80%.
The integral transmission of the focal reducer optics considering the
reflection coefficient of telescope mirrors and CCD efficiency
is QE ~ 50%. The quality of the image formed by the optics is
no worse than 10 pm in the plane of the CCD detector, which corresponds to FWHM
~ 0".3.
The optomechanics of the device
allows to introduce the movable optical elements into the optical path. The
optical filters can be additionally set in front of the collimator. Also,
between the collimator and the camera, a volume phase holographic grism (VPHG)
and a double Wollaston prism can be introduced into the parallel beam by moving
the linear guide carriage perpendicular to the central axis of the device; it
is also allowed to install other optical elements on the carriage.
Electro-mechanical
scheme
In the MAGIC scheme (Fig. 2), the light from the
telescope passes through the filter wheels (1) and (2). Each wheel has 9
positions for installing filters with a diameter of no more than 50 mm and a
thickness of no more than 5 mm. The first wheel, in addition to optical
filters, also includes:
• slit — long slit
(width 1".7, linear width — 0.11 mm)
• mask — mask for the
Wollaston prism (angular dimensions — 6".4 x 6".4, linear
dimensions — 25x25 mm)
• dots — a matrix of 8x8
pinholes with a diameter of 0.1 mm and a step of 3 mm for focusing optics and estimating
geometric distortions in polarimetry mode (linear dimensions — 25x25 mm)
|
CCD
readnoise (in e )
|
|
rate
|
|
|
under
-80° C
|
fast
(3.0 MHz)
|
norm
(1.0 MHz)
|
slow (0.1 MHz)
|
|
GAIN high(x4)
low (x1)
|
6.7 ±
0.03
|
4.8 ±
0.01
|
2.2 ±
0.01
|
|
11.3 ±
0.11
|
5.9 ±
0.06
|
2.7 ±
0.07
|
Zero position in each wheel is always
empty, and given the constant presence of slit, mask and dots, we have 13 positions to install the necessary replaceable
filters.
Next, there is the collimator (3)
with the focusing mechanism (4). In the heart of MAGIC is the mode changing
linear guide carriage for 4 positions (5) with the VPH-grism and the Wollaston
prism. The switching time between the adjacent carriage positions is 1 min.
After the mode carriage light comes through the camera (6) to the CCD detector
(7).
CCD characteristics
Andor iKon-L 936 CCD system with an
BEX2-DD type 2048 x 2048 px E2V CCD42-40 with a pixel size of 13.5 x 13.5 micron is
used as a detector. The mass of the CCD system is 7 kg. The quantum efficiency
of this device is >90% in the range of 400-850 nm and not less than
40% in the range of 340-990 nm, which is due to the optics is the working
spectral range MAGIC. We use default air cooling, which makes it possible to
conduct observations with a CCD temperature of about -80° C.
The laboratory measurements of
the gain value for the 1x 1 binning mode used in the observations are presented
in Table 1. We use two gain modes ’low’ (x1) and ’high’
(x4), as well as three readout rates for full frame - ’fast’ (4 sec), ’norm’ (9
sec) and ’slow’ (90 sec). The value of the measured readnoise for these modes
is shown in Table 2.
Note here that the measured values of CCD gain and readout noise differ
significantly from the values provided by the manufacturer.
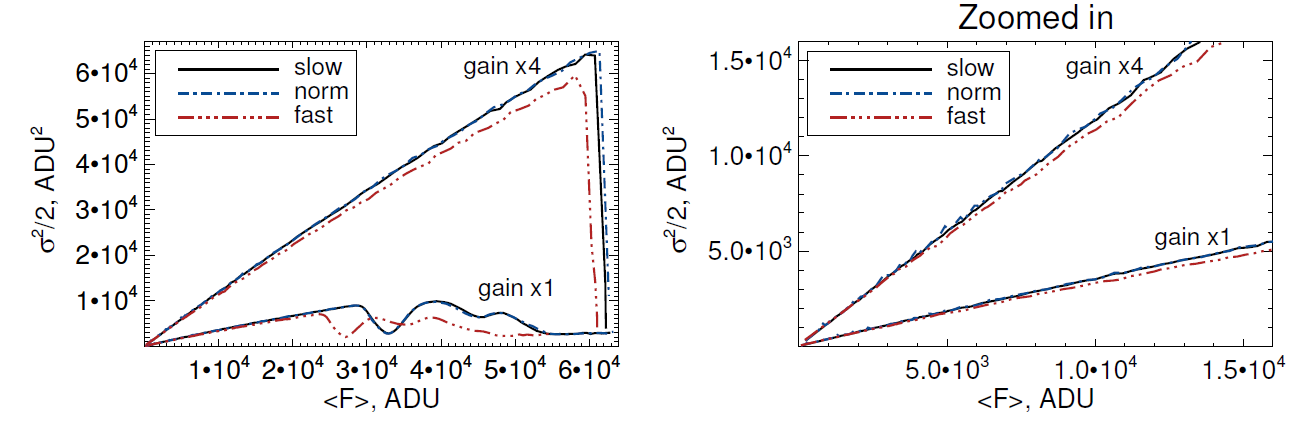
Fig. 6 The gain factor is determined
from the slope of the dependence of half of the variance of counts on the
average value of signal accumulation <F>. Left:
dependencies are presented for all gain modes and readout rates used in the
observations. Right: zoomed in on the same dependencies.
It is significant that there is a
misconception that the statistics of counts (analog digital units, ADU) in CCDs
correspond to Poisson ones. This assumption is laid down when determining the
gain factor of the analog-to-digital converter of the CCD registration path [2]. However, as can be seen in Fig. 6 (and
especially on the right panel, where the range of the graph is zoomed in), the
dependence of the counts variance on the average registered signal is different
from a strictly linear law. There are periodic fluctuations around a linear
dependence.
Also, based on the measurements
in Fig. 6, we can identify the
working ranges of ADU accumulation for observations in various modes (for gain
x1 and x4) of CCD iKon-L 936, where the signal dispersion behaves in the most
acceptable way. It can be concluded that for ( x1) low gain mode it is not
worth accumulating a signal of more than ~20k ADU.
On the other hand, for
astronomical observations, when the particular interest is in the registration
of weak signals, whose statistics are distorted by the readout noise introduced
by the electronics. To study the distortion of counts statistics, a test criterion
is used using the dispersion index, the so-called Fano factor [3]. The application of
the method to CCD studies is described in detail in [4]. By definition, the dispersion index is the ratio
of the variance of counts to the average value of the registered signal. For a
Poisson distribution, this ratio is equal to one, and this corresponds only to
a certain range of registered values. Fig. 7 shows graphs of the dependence of the dispersion
index on the magnitude of the registered signal in different modes for the
iKon-L 936 CCD. The left and right panels correspond to two gain modes - (x1) low and (x4) high respectively. These studies also provide insight into the optimal choice of exposure time in order to minimize the distortion of counts
statistics when observing astrophysical objects using the MAGIC focal reducer.
According to the measurements, the best fit to the Poisson statistics is
achieved when the signal is accumulated in the (x1) low gain mode at a ’slow’
readout rate from about a few hundred to ~10k ADU.
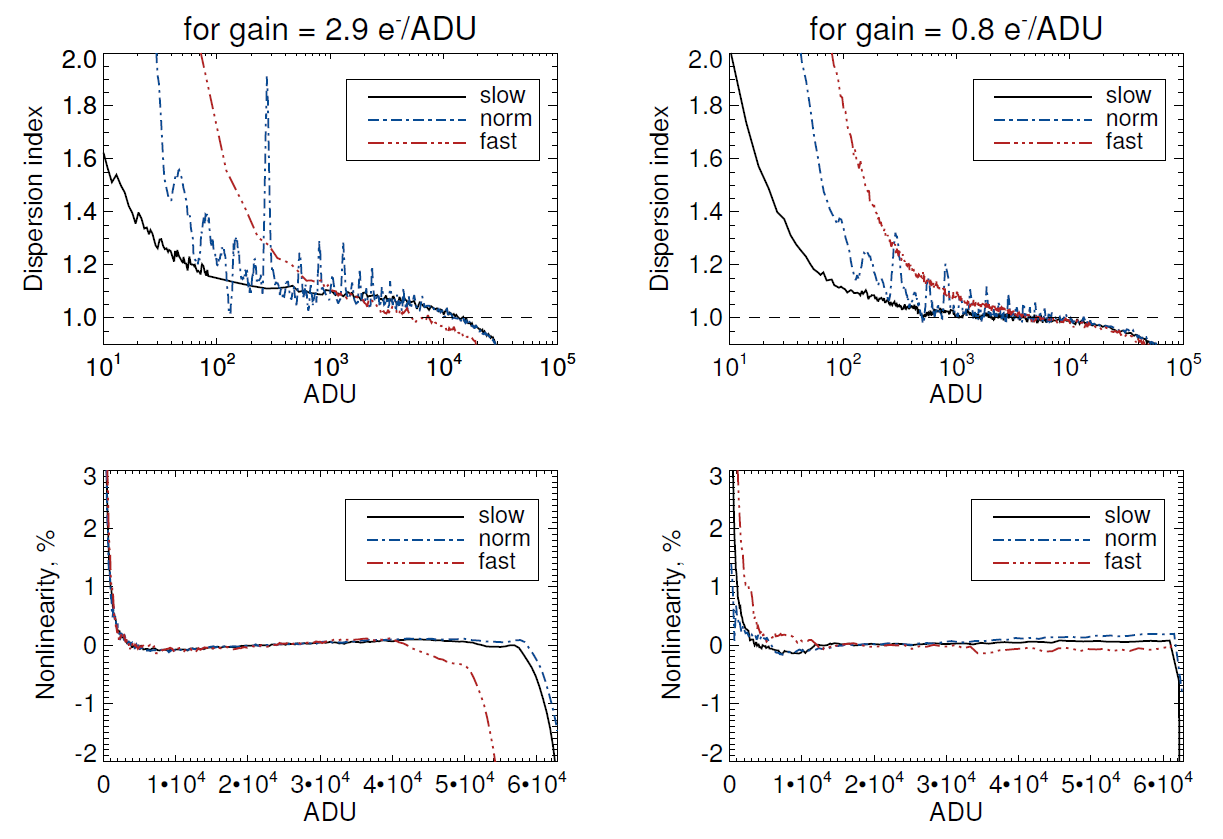
Fig. 7 Measurement of CCD
characteristics for all gain modes (left: x4 high, right: x1 low) and readout rates. The top panel shows the
dependence of the dispersion index on signal accumulation. The lower panel
shows the level of non-linearity of signal registration in the entire range of
accumulations.
Note here that for both CCD gain
modes used (x1 and x4) for the ’norm’ readout rate, ’sawtooth’ beats of the
dispersion index are observed. This negative feature we keep in mind during
observations.
Also in Fig. 7 on the bottom panel are measurements of the
deviation from signal linearity, which do not exceed 0.5% in the entire range
of signal accumulations used in observations.
CCDs with a thick, deep-depletion
silicon substrate provide high spectral sensitivity of the detector even in the
1 micron region. A powerful advantage of the iKon-L 936 CCD is the complete absence
of interference noise in the red part of the spectrum. .
Remote control
The control of the device, including
the rotator, guide and CCD, is implemented through several compact computers
installed on the telescope, which allows remote observations. In observations,
we use network access to the on-board computer in the remote desktop format.
The control interface is a graphical shell in the IDL environment MAGIC remote
control, a screenshot of which is shown in Fig. 8.
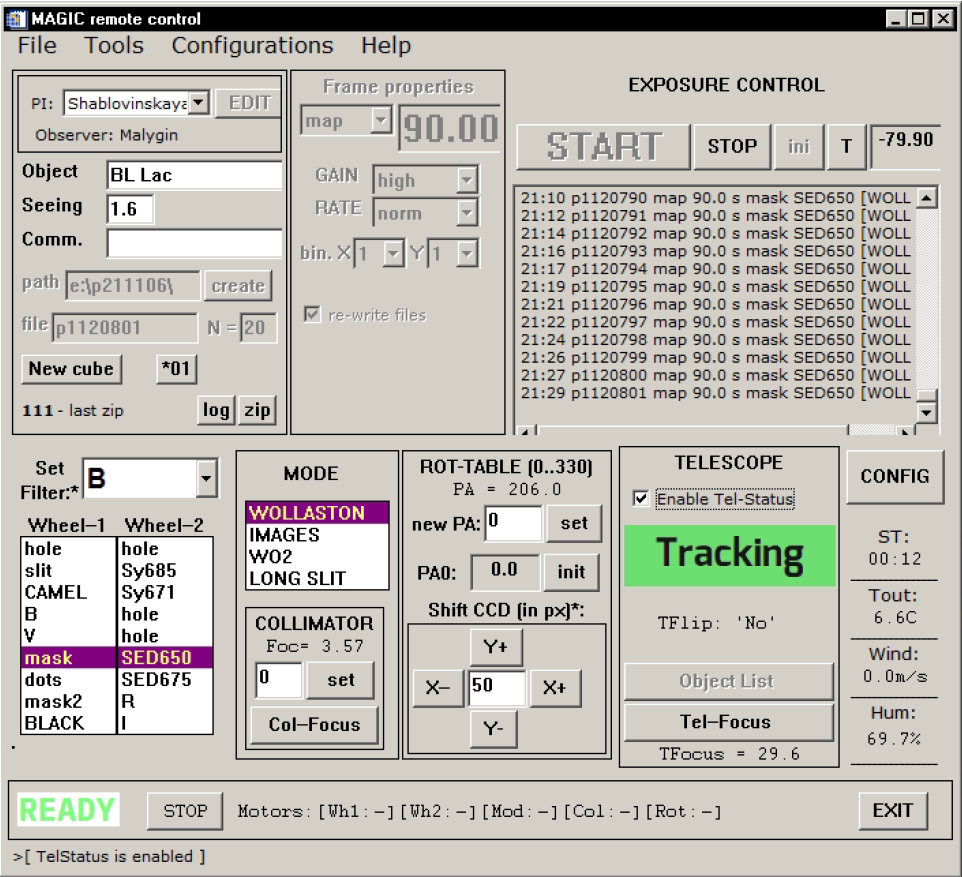
Fig. 8 MAGIC control
interface.
The upper half of the interface is used to
control the CCD detector and edit the information recorded in the FITS header
during the observations; the lower half is used to control the MAGIC (setting
the observation mode, focusing the collimator, and orientation) and some
telescope functions (small tube shifts and focusing). At the end of each
exposure, the resulting FITS file is opened for analysis in the FITS-viewer
(see Fig. 9) — here the
observer traditionally controls the levels of accumulation and the quality of
each frame. Note here that the image in the viewer is flipped along RA axis.
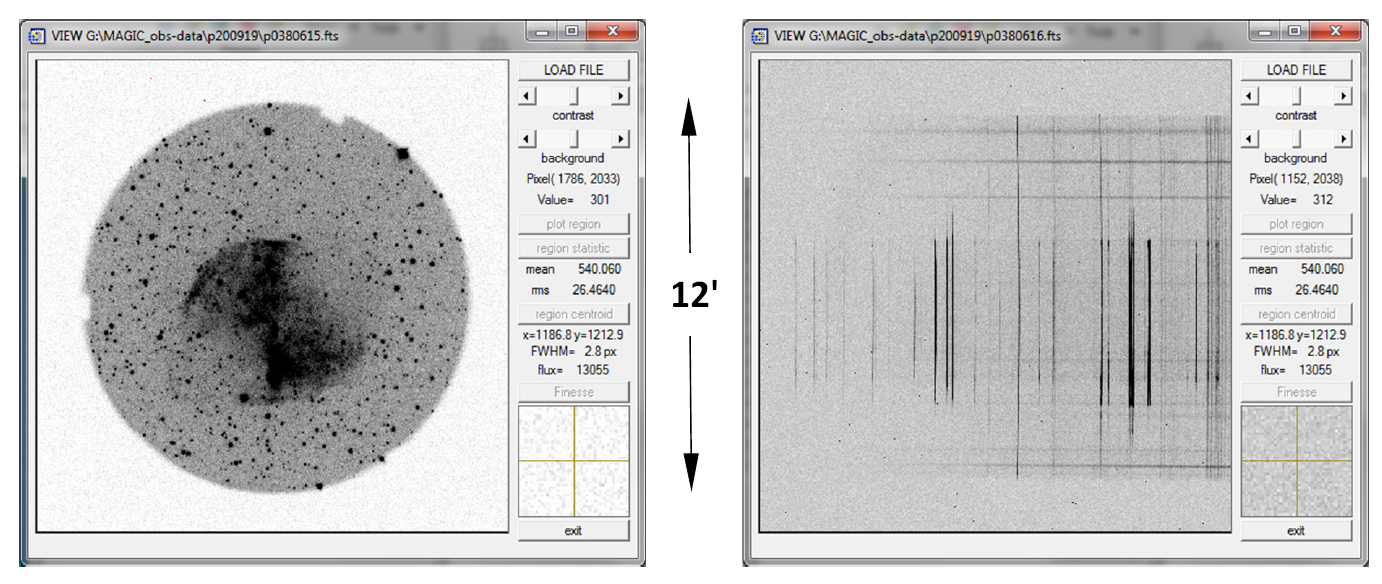
Fig. 9 Viewer
interface with frames of the M27 object in photometric (left, texp = 10 s in R-band) and spectral (right, texp = 600 s)
modes. Direct image FoV is 12' x 12', slit height is 12', slit width is 1''.7,
the wavelength range is 340-740 nm. The frames colors are inverted.
2 Observation Modes
Photometry
The photometric mode of observations
with the MAGIC device makes it possible to obtain direct images using various
light filters, which are introduced into the beam by means of two wheels. The
size of the FoV is limited by the size of the round filter and is ~12’. Note
that for photometry, as well as in other observation modes, we use 1x1 CCD
binning, which gives an image scale of 0".45/px and satisfies the
Kotelnikov-Nyquist theorem (sampling allows us to accurately restore the
PSF-profile). The device uses narrow-band and medium-band interference SED
filters [1],
as well as broad-band glass filters BVRI of the
Johnson-Cousins system [5].
In the case of the broadband filters, for converting instrumental quantities
into standard photometric system equations were
constructed neglecting the second-order extinction coefficients:
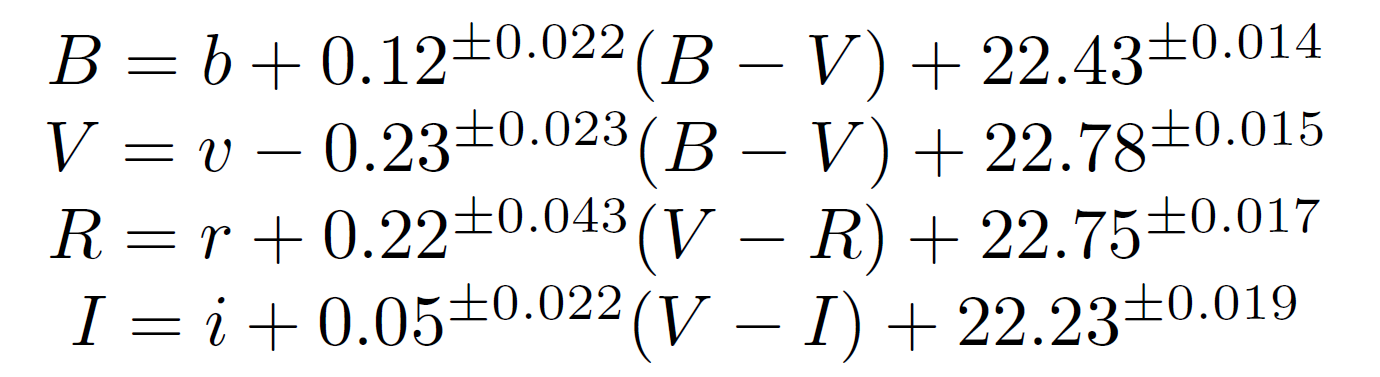
where B, V, R, I
are standard magnitudes in B-, V-,
R- and I-bands, b, v, r, i – instrumental magnitudes in
filters B, V, R, I, calculated as –2.5 • lg(N), where N is the number of counts
(ADU) per second acquired in the 2.8 e–/ADU gain mode.
Then the last term in each
equation (for the corresponding band) consists of (Z – α • X),
where Z is the zero point, α is the
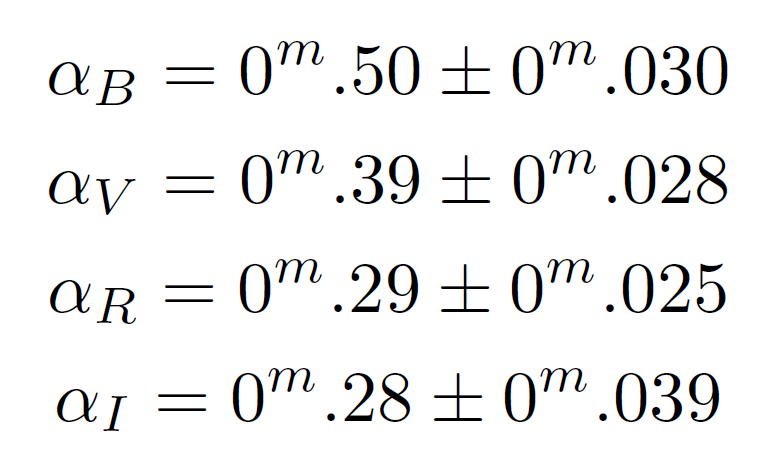
extinction coefficient, X is the air mass. We built
equations from measurements of 36 stars in the field NGC7654, which was
observed at a zenith distance z ~ 18° on September 22, 2020. The measured
extinction coefficients on this night were:
For our monitoring tasks, typical
magnitudes of observed objects are 16 mag in the V-band.
For 10 minutes of total exposure within a typical seeing of about 2" at
SAO, the accuracy for a star-like object is 0.005 mag. Providing the photometry
of faint sources in a V-band on a single frame with an
exposure time of 20 minutes for 22.5 mag we achieved S/N~4 within a 1".1 seeing.
Polarimetry
In the MAGIC device, we use a double Wollaston prism for tasks
of AGN polarimetry. The advantage of this analyzer is the ability to apply
the one-shot polarimetry approach when the number of
images of the FoV sufficient to calculate the Stokes parameters are
simultaneously registered at the detector in several angles of electric vector
oscillation. This method minimizes the effect of atmospheric depolarization
[for more details see 6].
We use the Wollaston quadrupole
prism, originally described in [7].
The prism was produced by OPTEL and consists of two Wollaston calcite prisms glued
together with a total size of 30x30x16 mm. To avoid overlapping images in
different polarization directions, the prism is used in conjunction with a
square mask giving a square FoV in each direction of 6'.4 x 6'.4.
As an example, the Fig. 10 shows a frame of the
M1 nebula, obtained with a Wollaston prism for 300 seconds of exposure in the
SED600 filter. As can be seen, four directions of polarization are registered
on the detector in the angles 0°, 90°, 45° and 135°. This makes it possible to
calculate three Stokes parameters I, Q, U,
which describe the intensity and linear polarization of radiation, as follows:
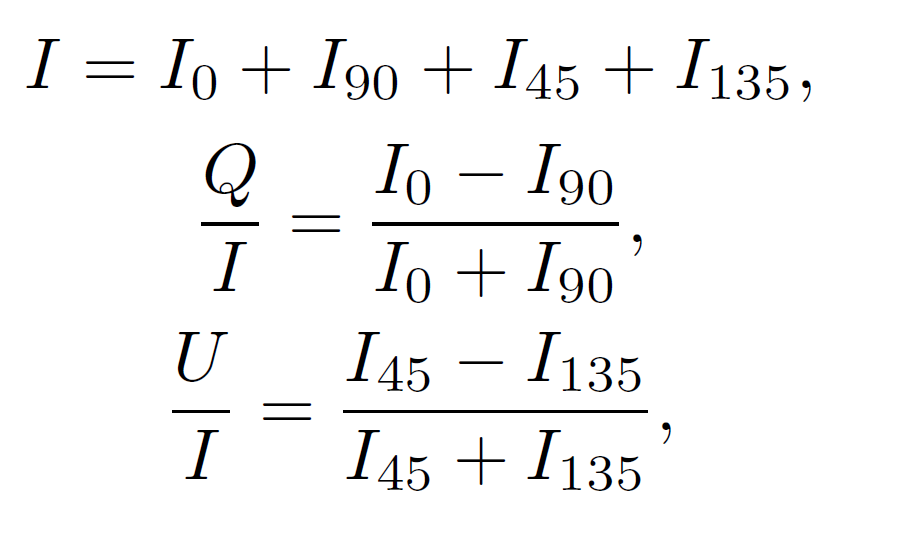
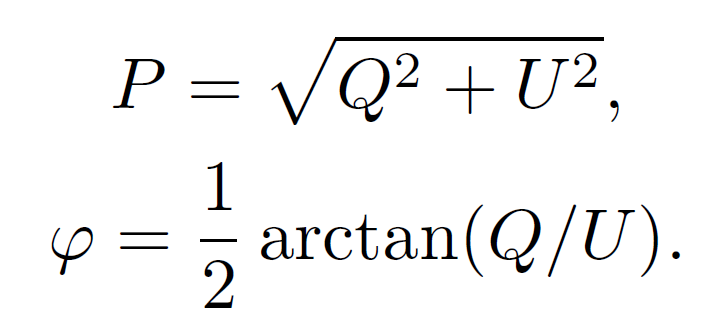
where I0, I90, I45, I135 are the intensity in each direction, respectively. Further, for
convenience, we will use the notation Q = Q/I and U = U/I. The degree of
polarization P and the angle of the plane of polarization
p are calculated by the formulas:
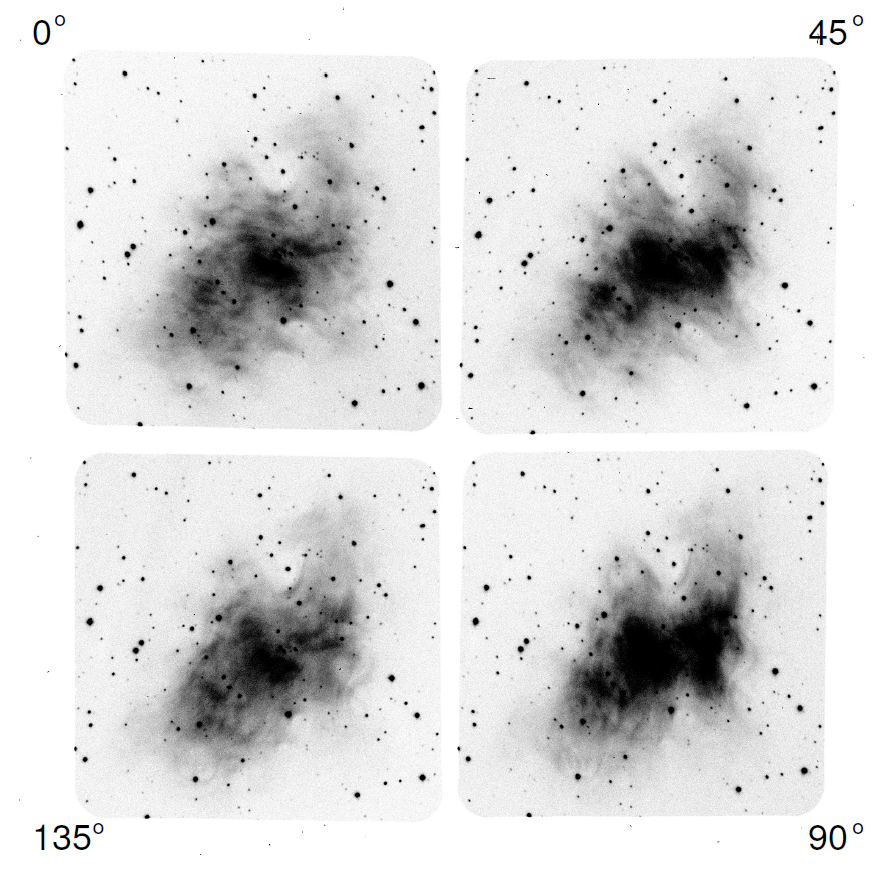
Fig. 10 Observation of M1 in four directions of polarization (each FoV = 6'
.4) with the quadrupole Wollaston prism in the SED600 filter (texp =
300 s).
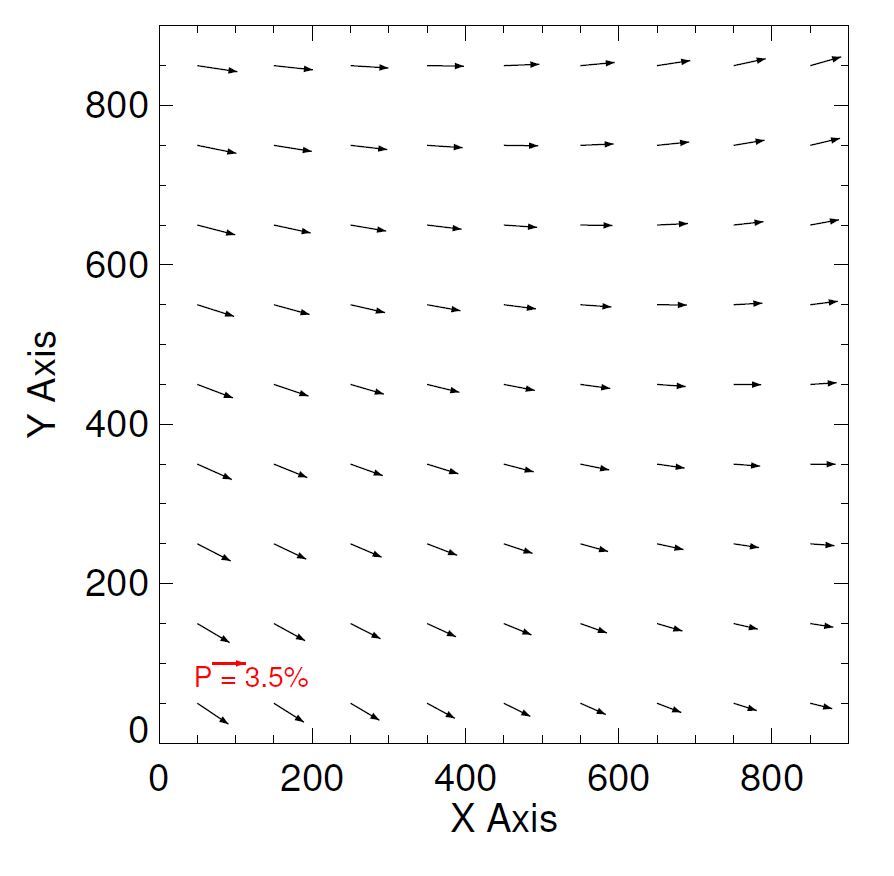
Fig. 11 Instrumental
polarization over the field inside the FoV of the quadrupole Wollaston prism.
Coordinates in pixels are given along the X and Y axes, the coordinate grid is
corrected for geometric distortions.
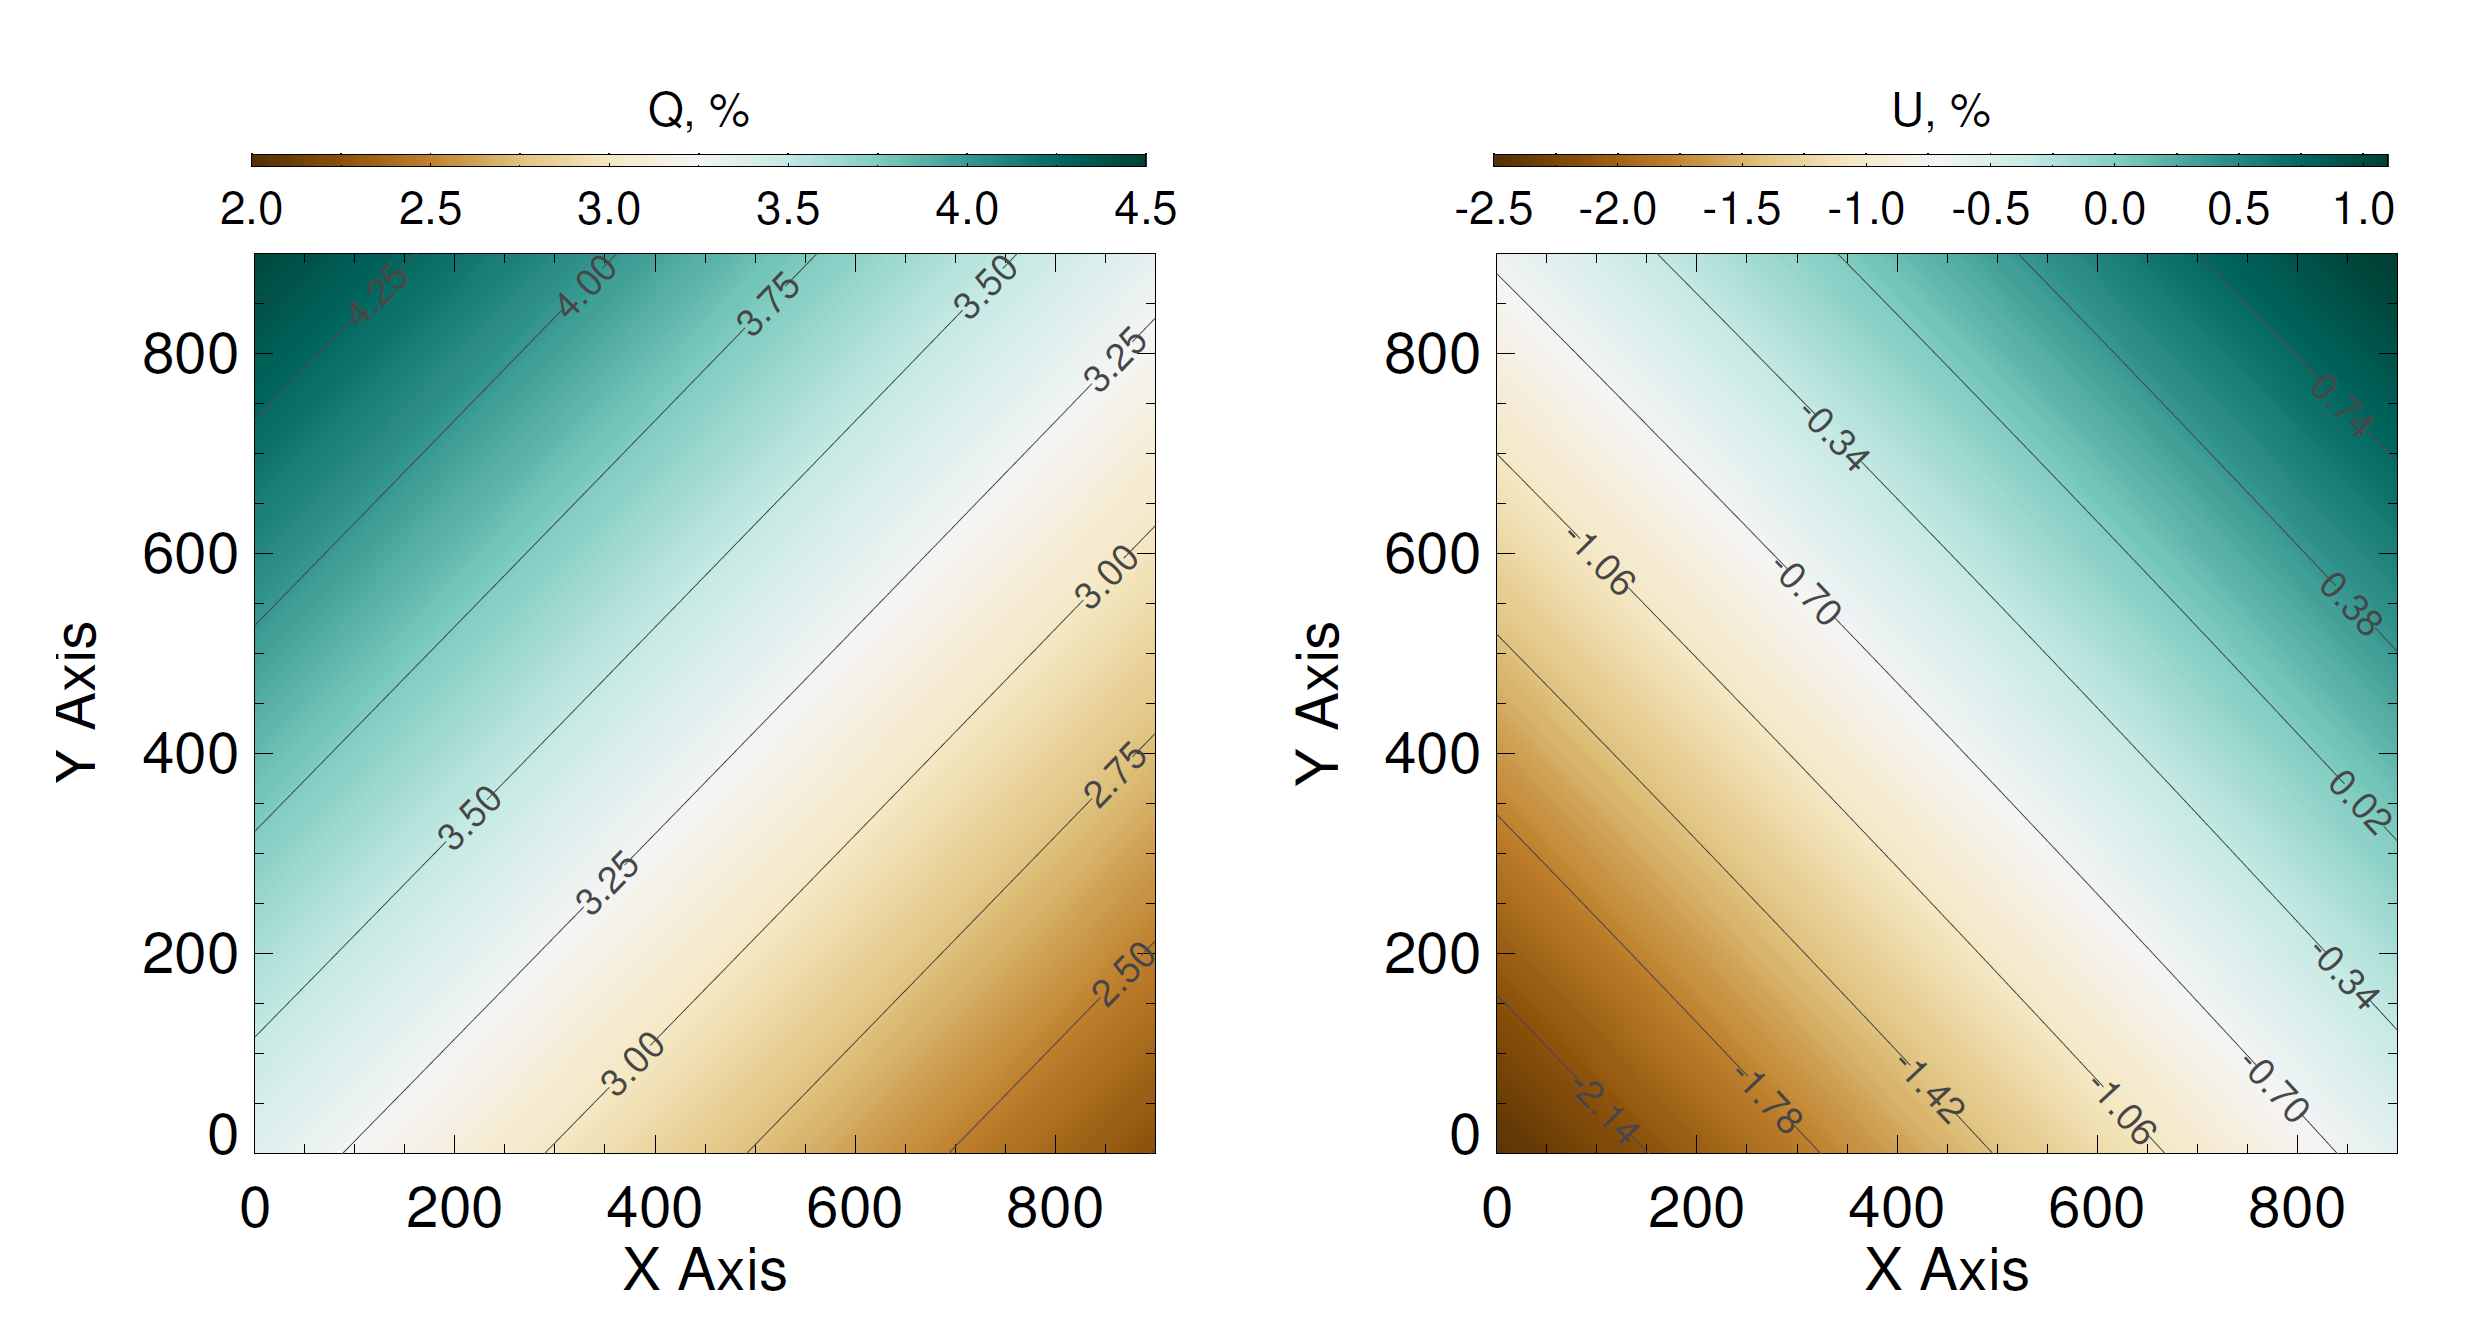
Fig. 12 For the Stokes
parameters Q and U, smooth variations over the field inside the square mask are
described.
Note that to rotate the Stokes
parameters to the celestial plane, the Stokes vector should be multiplied to
the rotation matrix of the — 2•PA angle, where PA is the instrument position
angle.
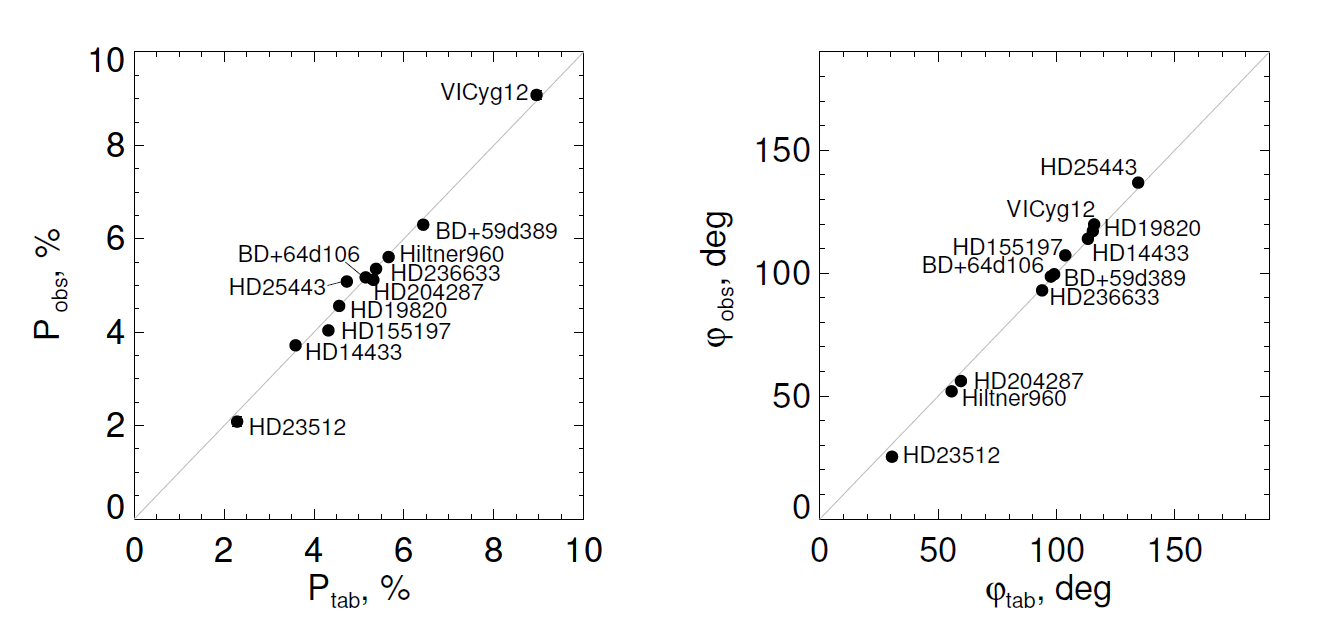
Fig. 13 Deviation of the measured
values of the degree of polarization Pobs (left)
and the polarization angle φobs (right)
from their reference values Ptab and φtab .
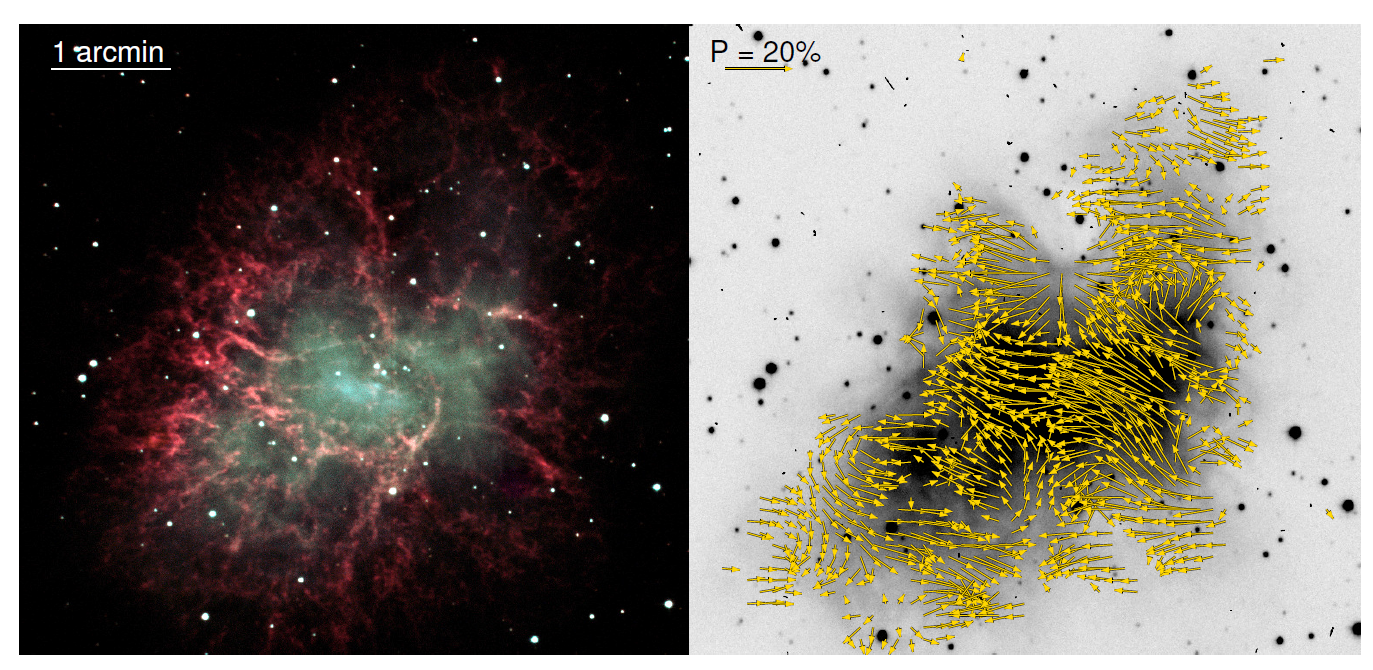
Fig. 14 Results of
observations of the M1 nebula: on the left, a combined
photometric image of the nebula in the B (blue), V (green), and
SED650 (red) filters; on the right is the polarization
map of the nebula obtained with the Wollaston quadrupole prism in the SED600
filter.
Due to the huge images
separation, the prism used in MAGIC has its own dispersion, much larger than
the more classic wedged version. Without the use of a filter in white light,
the dispersion will decompose the star-like source image into a low-dispersion
spectrum of >40" length. The use of broadband filters, for example, the
BVRI system, with this prism is also not justified, since
the distortions introduced by dispersion will be an order of magnitude greater
than seeing. For this reason, observations with this quadrupole Wollaston prism
are optimally carried out in medium-band filters.
Using the observations of
unpolarized standard stars, we estimated the value of the instrumental
polarization of the device within the FoV inside the mask. Repeated
observations of zero standards at different positions in the field, as well as
measuring the polarization of images forming by the 8-dots mask, which we use
to correct geometric field distortions, we found that the changes of
polarization are stable over time and has a smooth field dependence (Fig. 11). The average value
of the degree of polarization P introduced by the device
is 3.5% and varies over the field from 2.3% to 4.5%. The pattern and absolute
values of the instrumental polarization do not change with the wavelength in
the range 6000-7000A. Our laboratory tests of the optics and detector with
other polarization analyzers introduced into the beam showed that the source of
instrumental polarization is the prism.
We have described the Q and U changes by 1st order surfaces (Fig. 12). After correcting observations of unpolarized
stars for instrumental polarization using this model, the deviations of the
parameters Q and U from zero were
less than 0.05%. Thus, the correction of instrumental polarization makes it
possible to carry out high-precision polarimetric observations.
To determine the accuracy of the
data obtained in the polarimetric mode, we observed a set of high polarized
standard stars. On Fig. 13 the
dependence of the observed polarization degree P and polarization angle p for a
set of standard high polarization stars (after correction for instrumental
effects) are plotted against their reference values. The deviations were ΔР
= 0.18% and Δφ = 3°. In
general, according to our observations, for a star-like target up to 14 mag in
medium-band filters with a seeing of 1" for 20 minutes of total exposure,
the polarization accuracy is better than 0.6%.
The large field of view in the
one-shot polarimetry mode is an important advantage for polarization
observations of extended objects. An example of the results of such
observations is shown in Fig. 14.
For the Crab Nebula M1, a map of the change in the polarization of the
continuum (’amorphous’) radiation was obtained, which makes it possible to
compare the polarization characteristics of the nebula with its geometry.
Long slit spectroscopy
The spectral mode of the MAGIC device
is implemented by introducing into the collimated beam (between the camera and
the collimator) a direct vision grism VPHG600@500 (600 lines/mm, 500 nm -
central wavelength), as well as a slit into the converging beam in front of the
collimator. The efficiency of the device in the spectral mode (telescope +
optics + grating + CCD) does not exceed 18%.
The slit dimensions of 0.11 mm x
46 mm correspond to the angular dimensions 1".7 x 12' in the focal plane.
The width of the projected monochromatic slit image onto the CCD plane is FWHM
= 3.5 px. We chose the slit sizes to achieve the best compromise between
optimal CCD sampling, the required extragalactic spectral resolution, and minimizing light loss at the slit
under average SAO weather conditions. In conjunction with the spectral grating,
low-resolution spectra are obtained in the range 4000-7200 A with reciprocal
dispersion 2A/pix and spectral resolution SA — 7-8 A or in terms of R =
λ/ δλ ~ 1000.
On Fig. 15 the sequence of obtaining observational material
on the example of spectroscopy of type 1 AGN E1821+643 is demonstrated from
setting the object onto the slit (in the direct image mode) to obtaining the
processed 1D spectrum. It is interesting to note that in the presented frames,
due to such a long slit, several objects are simultaneously observed, including
the extended planetary nebula PN K 1-16 (indicated by number 1 in the Fig. 15). It is clear that
the slit height of 12' allows efficient spectroscopic observations of strongly
extended objects, for example, comets. Such a long slit also simplifies sky
subtraction when processing spectra.
At the moment, the development of
a calibration module is underway to obtain auxiliary frames of a spectral flat
field and a reference illumination of a He-Ne-Ar lamp for constructing a
dispersion curve. However, only slight bending of the device (within ±1 pix)
makes it possible to use an auxiliary appliance installed on the inside of the
telescope dome (see Fig. 1,
on the right) to obtain calibration frames, which gives Lambertian scattering
under illumination lamp.
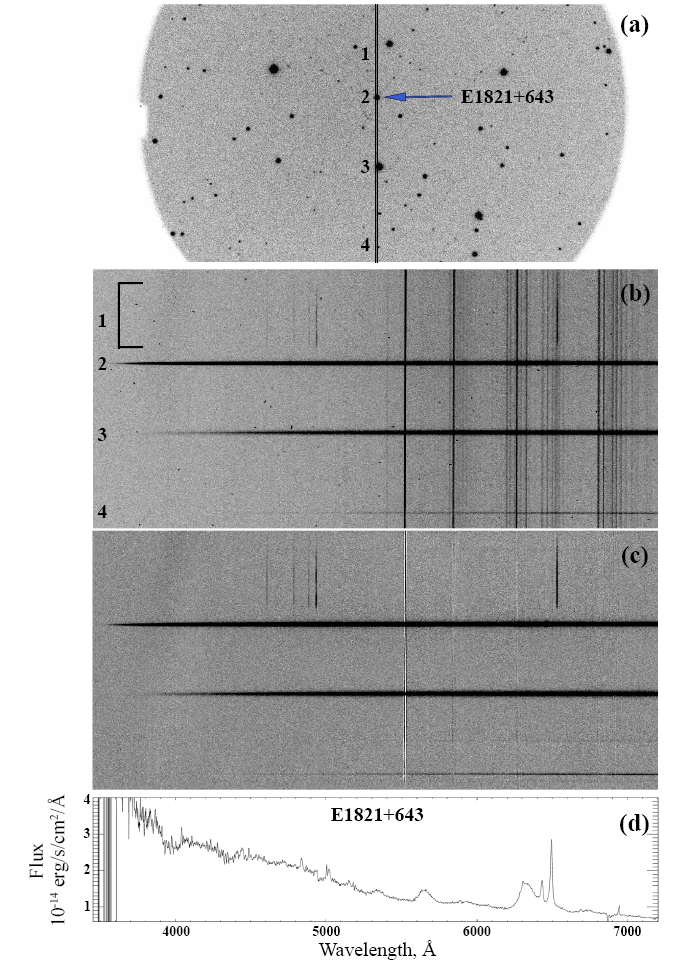
Fig. 15 MAGIC
spectroscopy of the E1821+643 quasar: (a) a fragment of a direct image in the R
filter (texp = 10 sec) with the position of the spectrograph slit
into which four objects fall, the arrow indicates the studied quasar; (b) -
single spectral frame (texp = 600 sec),
contains traces of cosmic particles; (c) - robustly averaged frame (texp = 8 x 600 sec) with geometric correction and
subtracted night sky spectrum; (d) integrated spectrum in the wavelength scale
of the quasar E1821+643. Marked in the figure: 1 - planetary nebula PN K 1-16;
2 - Sy1 galaxy E1821+643; 3 - star [SPB96] 1882; 4 - field star.
References
[1] Afanasiev, V.L., Malygin, E.A., Shablovinskaya, E.S., Uklein, R.I.,
Amirkhanyan, V.R., Perepelitsyn, A.E. and Afanasieva, I.V. Small telescopes
being effective: MAGIC or not? Experimental Astronomy (2023).
arXiv:2309.13371
RASTI
[ PDF is here ]
[2] Howell, S.B.: Handbook of CCD Astronomy. Cambridge University Press,
Cambridge (2006)
[3] Fano, U.: Ionization Yield of Radiations. II. The Fluctuations of
the Number of Ions. Physical Review 72(1), 26-29 (1947). https://doi.org/ 10.1103/PhysRev.72.26
[4] Afanasieva, I.V.: Study of distortions in statistics of counts in
ccd observations using the fano factor. Astrophysical Bulletin 71(3),
366370 (2016) arXiv:1608.06177 [astro-ph.IM].
https://doi.org/10.1134/ S199034131603010X
[5] Bessell, M.S.: UBVRI passbands. PASP 102,
1181-1199 (1990). https: //doi.org/10.1086/132749
[6] Afanasiev, V.L., Amirkhanyan, V.R.: Technique of polarimetric
observations of faint objects at the 6-m BTA telescope. Astrophysical Bulletin 67(4), 438-452 (2012) arXiv:1510.05269 [astro-ph.IM].
https://doi.org/ 10.1134/S1990341312040074
[7] Geyer, E.H., Kiselev, N.N., Chernova, G.P., Jockers, K.: Surface
Polarime- try of Comet Tanaka-Machholz 1992d Using a Novel Double Wollaston
Prism. In: Asteroids, Comets, Meteors 1993, vol. 810, p. 116 (1993)