Азбука космических расстояний

Почти невозможно ничего сказать о расстояниях до космических объектов. Почти, да не совсем, и астрономы разработали множество методов измерений расстояния. Здесь я опишу 26 из них. Я буду игнорировать работу, которая была проведена для определения астрономической единицы: мастштабного коэффициента для Солнечной системы, и только рассмотрим расстояния за нею.

A. ТРИГОНОМЕТРИЧЕСКИЙ ПАРАЛЛАКС

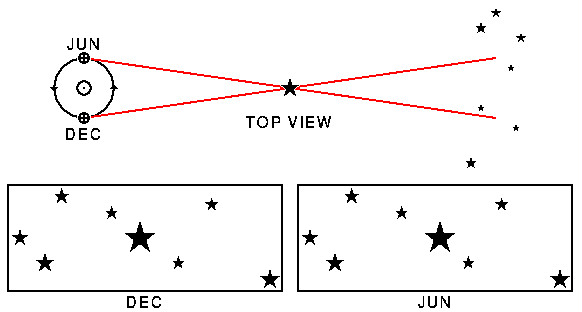
Этот метод помечен как A так как он является золотым стандартом для астрономических расстояний. Он основан на измерении двух углов и прилегающей стороны триугольника образуемого звездой, Землей на одной стороне орбиты и Землей шесть месяцев спустя на другой стороне орбиты.

Углового параллакса диаграмма

Верхняя часть диаграммы показывает Землю в разные времена и триугольник, и триугольник, образованный близкой звездой и этими двумя положениями Земли. Внизу показаны две картины близкой звезды, спроектированной на более удаленные звезды в этих двух сторонах орбиты Земли. Если вы скрестите свои глаза, чтобы слить эти две картины, вы или увидите близкую звезду стоящей впереди фона в трехмерии, или получите головную боль.

Параллакс звезды есть половина угла на звезду на этой диаграмме. Таким образом параллакс есть угол на звезду в триугольнике Земля-Солнце-звезда. Поскольку этот угол очень мал, синус и тангенс параллакса хорошо апроксимируются самим углом, измеренным в радианах. Следовательно расстояние на звезду

D[в см] = [Расстояние Земля-Солнце в см]/[параллакс в радианах]
Астрономы обычно называют Расстояние Земля-Солнце солнечной единицей 1 СЕ = 1.5E13 (15,000,000,000,000) см и измеряют малые углы в угловых секундах. Один радиан имеет 648000/Пи угловых секунд. Если мы используем эти единицы единица расстояния есть [648000/Пи] ае = 3.085678E18 см = 1 парсек. Звезда с параллаксом 1'' находится на расстоянии 1 парсек. Известные звезды не имеют столь большие параллаксы. Проксима Центавра имеет параллакc 0.76''.

Первый звездный параллакс звезды 61 Лебедя (61 Cigni) был измерен Фредериком Вильгельмом Бесселем (1784-1846) в 1838. Бессель известен также по функциям Бесселя в математической физике.

B. Движущиеся скопления

Не много звезд настолько близки, чтобы имеь значимые тригонометрические параллаксы. Но когда звезды находятся в устойчивом звездном скоплении, физический размер которого не меняется, как Плеады, то видимые движения звезд внутри скопления могут быть использованы для определения расстояний до скопления.
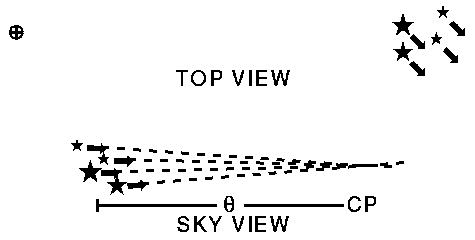
Параллакс движущегося скопления

В верхней части диаграммы показано пространственное движение скопления звезд. Заметим, что векторы скорости параллельны так что скопление не сжимается и не расширяется. Но когда мы смотрим на движения звезд, в проекции на небо, мы видим их сходящимися из-за эффектов перспективы. Угол на точку сходимости есть угол theta. Если скопление движется к нам, то точка сходимости находится за скоплением, но существует вторая точка сходимости на противоположной стороне неба и мы используем это. Из движений звезд по небу, известых как собственные движения так как они есть свойства of индивидуальных звезд, мы измеряем theta и его скорость изменения, d(theta)/dt. Нам также необходима радиальная скорость скопления VR измеряемая по спектрограммам, чтобы увидеть смещение Доплера. Поперечную скорость, VT, (движения вбок) скопления можно найти используя формулу VT/VR = tan(theta). Расстояние до скопления тогда равно
D[в см] = VT[в см/с]/[d(theta)/dt]

D[в пк] = (VR/4.74 км/с)*tan(theta)/{d(theta)/dt[в ''/год]}
Необычная константа 4.74 км/с есть 1 ае/год. Так как отрезок времени в 100 лет может быть использован для измерения d(theta)/dt, точные расстояния до близких звезд возможны. Этот метод применен к скоплению Гиады и дает расстояние 45.53 +/- 2.64 пк. Среднее для измеренных Гипаркосом тригонометрических параллаксов для членов скопления Гиады двет 46.34 +/- 0.27 пк (Перриман и др. ).

C. Вековые параллаксы

Другой метод может быть использован для измерения среднего расстояния до выборки звезд, если выбрать такие на почти одних и тех же расстояниях.
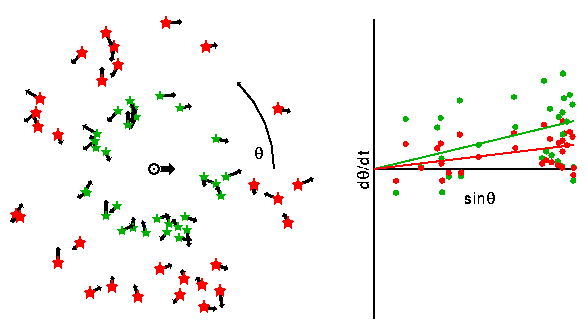
Statistical and secular parallax

На эта диаграмме показано такая выборка звезд, но с двумя возможными средними расстояниями. Зеленые звезды показывают малое среднее расстояние, в то время как красные звезды показывают большое среднее расстояние. Так как среднее движение Солнечной системы отностительно среднего для близких звезд будет существовать среднее собственное движение наружу от точки на небе, в сторону которой движется Солнечная система. Это точка называется апексом. Пусть угол на апекс есть theta. Тогда собственное движение d(theta)/dt будет иметь среднюю компоненту пропорциональную sin(theta), как показано линиями на графике d(theta)/dt от sin(theta). Пусть наклон этой линии будет mu. Тогда среднее расстояие до звезды есть
D[в см] = V(Солнце)[в см/с]/(mu [в радианах/с])

D[в пк] = 4.16/(mu [in ''/год])
где константа 4.16 есть Движение Солнца в ае/год.

D. Статистический параллакс

Когда у мвезд измерены радиальные скорости, то по рассеянию в их собственных движениях можно определить среднее расстояние. Это

		  (рассеяние в VR)[в см/с]
D[in cm] = ----------------------------------------
	   (рассеяние в d(theta)/dt)[в радианах/с]

E. Кинематические расстояния

Закон дифференциального вращения в нашей Галактике может быть использован для определения расстояния до источника, есть его радиальная скорость известна.

F. Параллакс расширения

Расстояние до расширяющегося объекта как остаток сверхновой, такой как Тихо можно измерить по:

  1. скорости углового расширения d(theta)/dt используя картину взятые с разницей в несколько лет, и
  2. по радиальной скорости расширения, VR, используя смещение Доплера в линиях газа, излучающего на передней и задней стороне оболочки. Когда спектрограф указывает на центр остатка, то видна двойная линия, с излучением, смещенным в красную (задняя стенка) и в голубую (передняя часть) область спектра.

Расстояние вычисляется тогда по формуле

D = VR/d(theta)/dt ,  где theta в радианах
У этого метода есть систематическая ошибка, тогда скорость вещества за ударным фронтом меньше чем скорость самого ударного фронта. В ОСН в адиабатической фазе это действительно имеет место, с VR = 0.75*V_sh, так что вычисленное расстояние на 25 % занижено.

G. Расстояние по световому эху

Центр эллиптического кольца вокруг SN1987A в БМО по-видимому есть результат наклонного кругового кольца вокруг звезды-предшественника. Когда импульс УФ света от сверхновой ударяет в кольцо, оно загорается линиями в УФ, которые наблюдались International Ultraviolet Explorer (IUE). Это первое обнаружение этих линий в момент, t1, и также время когда эти линии пришли от последней части освещенного кольца, t2, были оба ясно видны в кривой блеска УФ-линий, полученной на IUE. Если t0 есть время, в которое впервые увидели СН, то добавочные времена на распространение света от передней и задней сторон кольца равны:

t1 - t0 = R(1 - sin(i))/c
t2 - t0 = R(1 + sin(i))/c
где R есть радиус кольца в см. Итак
R = c(t1-t0 + t2-t0)/2
Когда телескоп HST был запущен на нем была получена картинка СН 1987A и было видно кольцо, и был измерен theta -- его угловой радиус. Это сотношение дает расстояние:
D = R/theta           theta в радианах
Применяя SN 1987A для БМО, получим D = 47 +/- 1 кпк (Gould 1995, ApJ, 452, 189). Этот метод тождествен методу расширения, в приложении к расширению оболочки излучения сверхновой, которое распространяется со скоростью света. Это может применить к другим известным геометриям также.

H. Спектроскопические визуальные двойные

Если орбита двойной системы наблюдается и визуально и спектроскопически, то и угловой размер и физический размер орбиты известны. Их отношение дает расстояние.


Для следующих методов необходима поверхностная яркость звезды. На рисунке, приведенном ниже, показана поверхностная яркость звезд, в зависимости от их цветов:
3 colored circles on a black background

Цвета приблизительно соответствуют температурам 5000, 6000 и 7000 К. Смещения цвета не велики, но изменения поверхностной яркости большие, в действительности, я обрезал изменения поверхностной яркости на полпорядка, чтобы сделать холодную звезду видимой. С помощью измерения отношения голубого потока от звезды к ее желто-зеленому потоку, астрономы измеряют B-V цвет звезды. Эта мера отношение голубого к видимому потоку может быть использована для оценки поверхностной яркости S_bзвезды. Так как видимый поток измерен хорошо, угловой радиус theta известен из формулы theta = sqrt[Flux/(pi*S_b)]. Если физический радиус R может быть хорошо известен, расстояние следует из D = R/theta с theta в радианах.

I. Метод Бааде-Васселинка

Этот метод применяется для пульсирующих звезд. Используя кривые блеска и цвета, находят отношение радиусов на различных временах:

              sqrt[Flux(t2)/SB(Color(t2)]
R(t2)/R(t1) = ---------------------------
              sqrt[Flux(t1)/SB(Color(t1)]
Then spectra of the star throughout its pulsation period are used Затем спектры звезд по из периоду пульсаций использованы для нахождения их радиальной скорости Vr(t). Knowing how fast the star's surface is moving, one finds R(t2)-R(t1) by adding up velocity*time during the time interval between t1 and t2. If you know both the ratio of the radii R(t2)/R(t1) from fluxes and colors and the difference in the radii R(t2)-R(t1) from spectroscopy, then you have two equations in two unknowns and it is easy to solve for the radii. With the radius and angle, the distance is found using D = R/theta.

J. Spectroscopic Eclipsing Binaries

In a double-lined spectroscopic binary, the projected size of the orbit a*sin(i) is found from the radial velocity amplitude and the period. In an eclipsing binary, the relative radii of the stars R1/a and R2/a and the inclination of the orbit i are found by analyzing the shapes of the eclipse light curves. Using the observed fluxes and colors to get surface brightnesses, the angular radii of the stars can be estimated. R1 is found from i, a*sin(i) and R1/a; and with theta1 the distance can be found.

K. Expanding Photosphere Method

The Baade-Wesselink method can be applied to an expanding star: the variations in radius do not have to be periodic. It has been applied to Type II supernovae, which are massive stars with a hydrogen rich envelope that explode when their cores collapse to from neutron stars. It can also be applied to Type Ia supernovae, but these objects have no hydrogen lines in their spectra. Since the surface brightness vs color law is calibrated using normal, hydrogen-rich stars, the EPM is normally used on hydrogen-rich supernovae, which are Type II. The Type II SN1987A in the Large Magellanic Cloud has been used to calibrate this distance indicator.


The following methods use the H-R diagram of stars, which gives the luminosity as a function of temperature. When the luminosity and flux of an object are known, the distance can be found using
D = sqrt[L/(4*pi*F)]

L. Main Sequence Fitting

When distances to nearby stars were found using trigonometric parallaxes in the late 19th and early 20th century, it became possible to study the luminosities of stars. Einar Hertzsprung and Henry Norris Russell both plotted stars on a chart of luminosity and temperature. Most stars fall on a single track, known as the Main Sequence, in this diagram, which is now known as the H-R diagram after Hertzsprung and Russell. Often the absolute magnitude is used instead of the luminosity, and the spectral type or color is used instead of the temperature.

When looking at a cluster of stars, the apparent magnitudes and colors of the stars form a track that is parallel to the Main Sequence, and by correctly choosing the distance, the apparent magnitudes convert to absolute magnitudes that fall on the standard Main Sequence.

M. Spectroscopic Parallax

When the spectrum of a star is observed carefully, it is possible to determine two parameters of the star as well as the chemical abundances in the star's atmosphere. The first of these two parameters is the surface temperature of the star, which determines the spectral type in the range OBAFGKM from hottest to coolest. The hot O stars show ionized helium lines, the B stars show neutral helium lines, the A stars have strong hydrogen lines, the F and G stars have various metal lines, and the coolest K and M stars have molecular bands. The spectral classes are further subdivided with a digit, so the Sun is a G2 star.

The second parameter that can be determined is the surface gravity of the star. The higher the surface gravity, the higher the pressure in the atmosphere, and high pressure leads to line broadening and also reduces the amount of ionization in the atmosphere. The surface gravity is denoted by the luminosity class denoted by a Roman numeral from I to V with I being the lowest gravity and V being the highest (except for class VI which is sometimes seen and for white dwarfs which separately classified.) Stars with high surface gravity (class V) are called dwarfs while stars with medium gravity (class III) are called giants and stars with low gravity (class I) are called supergiants. The use of surface gravity to determine the luminosity of a star depends on three relations:

L = 4*pi*sigma*T4*R2
L = A*Mb                      Mass-luminosity law with b = 3-4
g = G*M/R2
Given the temperature from the spectral type, and the surface gravity from the luminosity class, these equations can be used to find the mass and luminosity. If the luminosity and flux are known the distance follows from the inverse square law.

One warning about this method: it only works for normal stars, and any given single object might not be normal. Main sequence fitting in a cluster is much more reliable since with a large number of stars it is easy to find the normal ones.


The following methods use the properties of pulsating stars:

N. RR Lyrae Distance

RR Lyrae stars are pulsating stars like Cepheids, but they are low mass stars with short periods (less than a day). They are seen in globular clusters, and appear to all have the same luminosity. Since the masses of RR Lyrae stars are determined by the masses of stars which are evolving off the main sequence, this constant luminosity may be caused by the age similarity in globular clusters.

O. Cepheid Distance

Cepheid variable stars are pulsating stars, named after the brightest member of the class, Delta Cephei. These stars pulsate because the hydrogen and helium ionization zones are close to the surface of the star. This more or less fixes the temperature of the variable star, and produces an instability strip in the H-R diagram.

1.5 cycles of pulsation

The diagram above shows the star getting bigger and cooler, then smaller and hotter. Cepheids are brightest when they are hottest, close to the minimum size. Since all Cepheids are about the same temperature, the size of a Cepheid determines its luminosity. A large pulsating object naturally has a longer oscillation period than a small pulsating object of the same type. Thus there is a period-luminosity relationship for Cepheids. If have two Cepheids with periods that differ by a factor of two, the longer period Cepheid is approximately 2.5 times more luminous than the short period one. Since it is easy to measure the period of a variable star, Cepheids are wonderful for determining distances to galaxies. Furthermore, Cepheids are quite bright, so they can be seen in galaxies as far away as the Virgo cluster, such as M100 The only problem with Cepheids is the calibration of the period-luminosity relation, which must be done indirectly using Cepheids in the Magellanic clouds and Cepheids in star clusters with distances determined by main sequence fitting. And one has to worry that the calibration could depend on the metal abundance in the Cepheids, which is much lower in the LMC than in luminous spirals like M100.


The following methods use the properties of objects in galaxies and must be calibrated:

P. Planetary Nebula Luminosity Function

Planetary nebulae are stars which have evolved through the red giant and asymptotic giant phases, and have ejected their remaining hydrogen envelope, which forms an ionized nebula surrounding a very hot and small central star. They emit large amounts of light in the 501 nm line of doubly ionized oxygen [O III] which makes them easy to find. The brightest planetary nebulae seem to have the same brightness in many external galaxies, so their fluxes can be used as a distance indicator. This method is correlated with the Surface Brightness Fluctuation method, which is sensitive to the asymptotic giant branch (AGB) stars before they eject their envelopes.

Q. Brightest Stars

When a galaxy is very nearby, individual stars can be resolved. The brightness of these stars can be used to estimate the distance to the galaxy. Often people assume that there is a fixed upper limit to the brightness of stars, but this appears to be a poor assumption. Nonetheless, if a large population of bright stars is studied, a reasonable distance estimate can be made.

R. Largest H II Region Diameters

Hot luminous stars ionize the hydrogen gas around them, producing an H II region like the Orion nebula. The diameter of the largest H II region in external galaxies has been taken as a "standard rod" that can be used to determine distances. But this appears to be a poor assumption.

S. Surface Brightness Fluctuations

When a galaxy is too distant to allow the detection of individual stars, one can still estimate the distance using the statistical fluctuation in the number of stars in a pixel. A nearby galaxy might have 100 stars projected into each pixel of an image, while a more distant galaxy would have a larger number like 1000. The nearby galaxy would have +/- 10% fluctuations in surface brightness (1/sqrt(N)), while the more distant galaxy would have 3% fluctuations. A
figure [75 kB] to illustrate this shows a nearby dwarf galaxy, a nearby giant galaxy, and the giant galaxy at a distance such that its total flux is the same as that of the nearby dwarf. Note that the distant giant galaxy has a much smoother image than the nearby dwarf.

T. Type Ia Supernovae

Type Ia supernovae are the explosions of white dwarf stars in binary systems. Accretion from a companion raises the mass above the maximum mass for stable white dwarfs, the Chandrasekhar limit. The white dwarf then starts to collapse, but the compression ignites explosive carbon burning leading to the total disruption of the star. The light output come primarily from energy produced by the decay of radioactive nickel and cobalt produced in the explosion. The peak luminosity is correlated with the rate of decay in the light curve. When this correction is applied, the relative luminosity of a Type Ia SN can be determined to within 20%. A few SNe Ia have been in galaxies close enough to us to allow the Hubble Space Telescope to determine absolute distances and luminosities using Cepheid variables, leading to one of the best determinations of the Hubble constant.
The following methods use the global properties of galaxies and must be calibrated:

U. Tully-Fisher Relation

The rotational velocity of a spiral galaxy is an indicator of its luminosity. The relation is approximately
L = Const * V(rot)4
Since the rotational velocity of a spiral galaxy can be measured using an optical spectrograph or radio telescopes, the luminosity can be determined. Combined with the measured flux, this luminosity gives the distance. The diagram below shows two galaxies: a giant spiral and a dwarf spiral, but the small galaxy is closer to the Earth so they both cover the same angle on the sky and have the same apparent brightness.
Two spiral galaxies

But the distant galaxy has a greater rotational velocity, so the difference between the redshifted and blueshifted sides of this distant giant galaxy will be larger. Thus the relative distances of the two galaxies can be determined.

V. Faber-Jackson Relation

The stellar velocity dispersion sigma(v) of stars in an elliptical galaxy is an indicator of its luminosity. The relation is approximately
L = Const * sigma(v)4
Since the velocity dispersion of an elliptical galaxy can be measured using an optical spectrograph, the luminosity can be determined. Combined with the measured flux, this luminosity gives the distance.

W. Brightest Cluster Galaxies

The brightest galaxy in a cluster of galaxies has been used as a standard candle. This assumption suffers from the same difficulties that plague the brightest star and largest H II region methods: rich clusters with many galaxies will probably have examples of the most luminous galaxies even though these galaxies are very rare, while less rich clusters will probably not have such luminous brightest members.
The following methods require no calibration:

X. Gravitational Lens Time Delay

When a quasar is viewed through a gravitational lens, multiple images are seen, as shown in diagram below.

Lensing galaxy forming two images of a background quasar

The light paths from the quasar to us that form these images have different lengths that differ by approximately D*[cos(theta1)-cos(theta2)] where theta is the deflection angle and D is the distance to the quasar. Since quasars are time variable sources, we can measure the path length difference by looking for a time-shifted correlated variability in the multiple images. As of the end of 1996, this time delay has been measured in 2 quasars: the original double QSO 0957+061, giving a result of Ho = [63 +/- 12] km/sec/Mpc, and PG1115+080, giving a result of Ho = 42 km/sec/Mpc, but another analysis of the same data gives Ho = [60 +/- 17] km/sec/Mpc.

Y. Sunyaev-Zeldovich Effect

Hot gas in clusters of galaxies distorts the spectrum of the cosmic microwave background observed through the cluster. The diagram below shows a sketch of this process. The hot electrons in the cluster of galaxies scatter a small fraction of the cosmic microwave background photons and replace them with slightly higher energy photons.
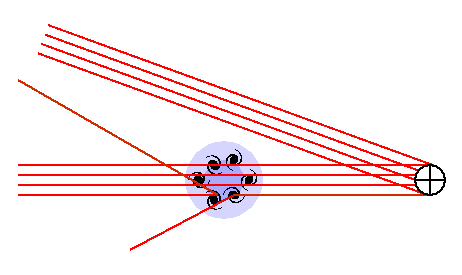
Gas in clusters of galaxies scattering CMB photons

The difference between the CMB seen through the cluster and the unmodified CMB seen elsewhere on the sky can be measured. Actually only about 1% of the photons passing through the cluster are scattered by the electrons in the hot ionized gas in the cluster, and these photons have their energies increased by an average of about 2%. This leads to a shortage of low energy photons of about 0.01*0.02 = 0.0002 or 0.02% which is gives a decrease in the brightness temperature of about 500 microK when looking at the cluster. At high frequencies (higher than about 218 GHz) the cluster appears brighter than the background. This effect is proportional to (1) the number density of electrons, (2) the thickness of the cluster along our line of sight, and (3) the electron temperature. The parameter that combines these factors is called the Kompaneets y parameter, with y = tau*(kT/mc2). Tau is the optical depth or the fraction of photons scattered, while (kT/mc2) is the electron temperature in units of the rest mass of the electron.

The X-ray emission, IX, from the hot gas in the cluster is proportional to (1) the square of the number density of electrons, (2) the thickness of the cluster along our line of sight, and (3) depends on the electron temperature and X-ray frequency. As a result, the ratio

y2/IX = CONST * (Thickness along LOS) * f(T)
If we assume that the thickness along the LOS is the same as the diameter of the cluster, we can use the observed angular diameter to find the distance.

This technique is very difficult, and years of hard work by pioneers like Mark Birkinshaw yielded only a few distances, and values of Ho that tended to be on the low side. Recent work with close packed radio interferometers operating at 30 GHz has given precise measurements of the radio brightness decrement for 18 clusters, but only 3 of these have adequate X-ray data.


And finally:

Z. The Hubble Law

The Doppler shift gives the redshift of a distant object which is our best indicator of its distance, but we need to know the Hubble constant.


But wait, there's MORE! Pulsar dispersion measures and interstellar extinction increase with distance along a given line of sight and can be used to determine distances. The globular cluster luminosity function can be used to estimate the distance to a galaxy from the observed brightness of its globular clusters.

Наставления : Часть 1 | Часть 2 | Часть 3 | Часть 4 | Возраст | Расстояния | Библиография | Относительность

© 1996-1999 Edward L. Wright. Последняя правка 6-Окт-1999