Light from moving objects will appear to have different wavelengths
depending on the relative motion of the source and the observer.

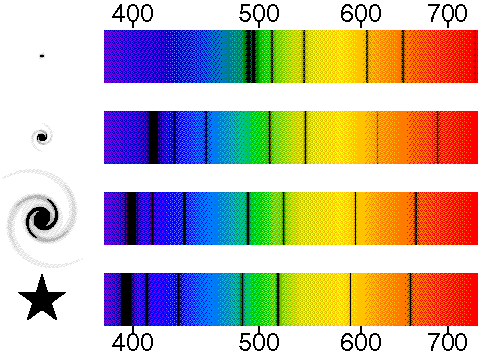
The schematic diagram below shows a galactic star at the bottom left with
its spectrum on the bottom right.
The spectrum shows the dark absorption lines first seen by Fraunhofer.
These lines can be used to identify the chemical elements in distant
stars, but they also tell us the radial velocity.
The other three spectra and pictures from bottom to top show a nearby
galaxy, a medium distance galaxy, and a distant galaxy.
The pictures on the left are negatives, of course, so the brightest
parts of the galaxies are black. Notice how
the pattern of absorption lines shifts to the red as the galaxies get
fainter.
The numbers above and below the spectra are the measured wavelengths
in nanometers.

1 + z = lambda(observed)/lambda(emitted)so z = 0.01 for the bright galaxy. The radial velocity is usually approximated by v(rad) = cz, where c is the speed of light, The medium bright galaxy is moving away is 15,000 km/sec with z = 0.05, while the faintest and most distant galaxy is moving away at 75,000 km/sec with z = 0.25.
© 1996-1999 Edward L. Wright. Last modified 31-Aug-1999