The angular power spectrum of the anisotropy of the CMB
contains information about the formation of the Universe and its
current contents. This angular power spectrum is a plot of how much
the temperature varies from point to point on the sky (the y-axis
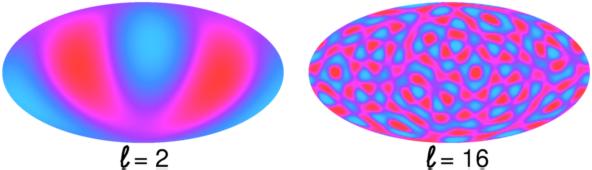
variable) vs. the angular frequency ell (the x-axis
variable). Ell=10 means that there are ten cycles in the fluctuation
around the whole sky, while ell=100 means that there are 100 cycles
around the sky.
Many groups are trying the measure the angular power spectrum, and
this data is expected to answer fundamental questions about the nature
of the Universe. So it gets into the newspapers often, from the
COBE results in April 1992 to the BOOMERanG results in April 2000.
The current status of microwave background anisotropy measurements in my
compilation from the literature has 95 data points from 25 experiments.
These are all plotted in the figure below:
But if we bin and average the data points
using a running weighted median we get the figure below which
agrees well with the standard
CDM model!
The yellow band in these figures is the expected noise from the MAP mission which is scheduled for launch in 2001. By doing an all-sky measurement, MAP will provide the best possible anisotropy measurements in the angular frequency range ell < 400, and will thus definitely clean up the messy region between ell = 20 and ell = 100 in the current data. For angular frequencies from 100 < ell < 250 there is already a large amount of ground-based and balloon-borne data, with more to come, but MAP will provide data with much improved sensitivity out to ell = 1000. This will provide an independent way to measure the cosmological constant which has been suggested by observations of supernovae. Even though the width of the yellow band is invisible on the figure for 400 < ell < 1000, MAP will in fact be radiometer noise limited in this band. The European space mission Planck, to be launched in 2007, will provide much better data than MAP over the range of angular frequencies 600 < ell < 2000.
Tutorial:
Part 1 |
Part 2 |
Part 3 |
Part 4
FAQ |
Age |
Distances |
Bibliography |
Relativity
© 1999-2000 Edward L. Wright. Last modified 10-May-2000